
- LIVE QUOTES
- LEARN
- HELP
 Nasdaq
 Wall Street Journal
EN
Is Leonardo DRS (DRS) Starting To Look Fully Priced After Its Strong Three Year Run
- If you are wondering whether Leonardo DRS is still reasonably priced after its recent run, this article walks through what the current numbers may imply about value.
- The stock most recently closed at US$37.20, with returns of 9.1% over 7 days, 9.7% over 30 days, 7.0% year to date and 12.9% over the past year, as well as a very large 3 year return of 194.0%.
- Recent coverage has focused on Leonardo DRS as a US defense and electronics business, with investors watching how its positioning in military technology could affect long term demand. This context has helped frame how market participants interpret the recent share price performance and the risks that come with it.
- Right now, Leonardo DRS has a valuation score of 3 out of 6, which means it screens as undervalued on half of the checks we use. Next, we will walk through what those checks involve, compare a few common valuation methods and then finish with a more holistic way to think about value that brings everything together.
Find out why Leonardo DRS's 12.9% return over the last year is lagging behind its peers.
Approach 1: Leonardo DRS Discounted Cash Flow (DCF) Analysis
A Discounted Cash Flow, or DCF, model estimates what a business could be worth by projecting its future cash flows and discounting them back to today to reflect time and risk.
For Leonardo DRS, the model uses a 2 Stage Free Cash Flow to Equity approach. It starts from last twelve months free cash flow of about $284.1 million. Analysts provide free cash flow estimates out to 2027, including $343.6 million in 2027, and Simply Wall St then extrapolates those forecasts out to 2035 using gradually moderating growth assumptions.
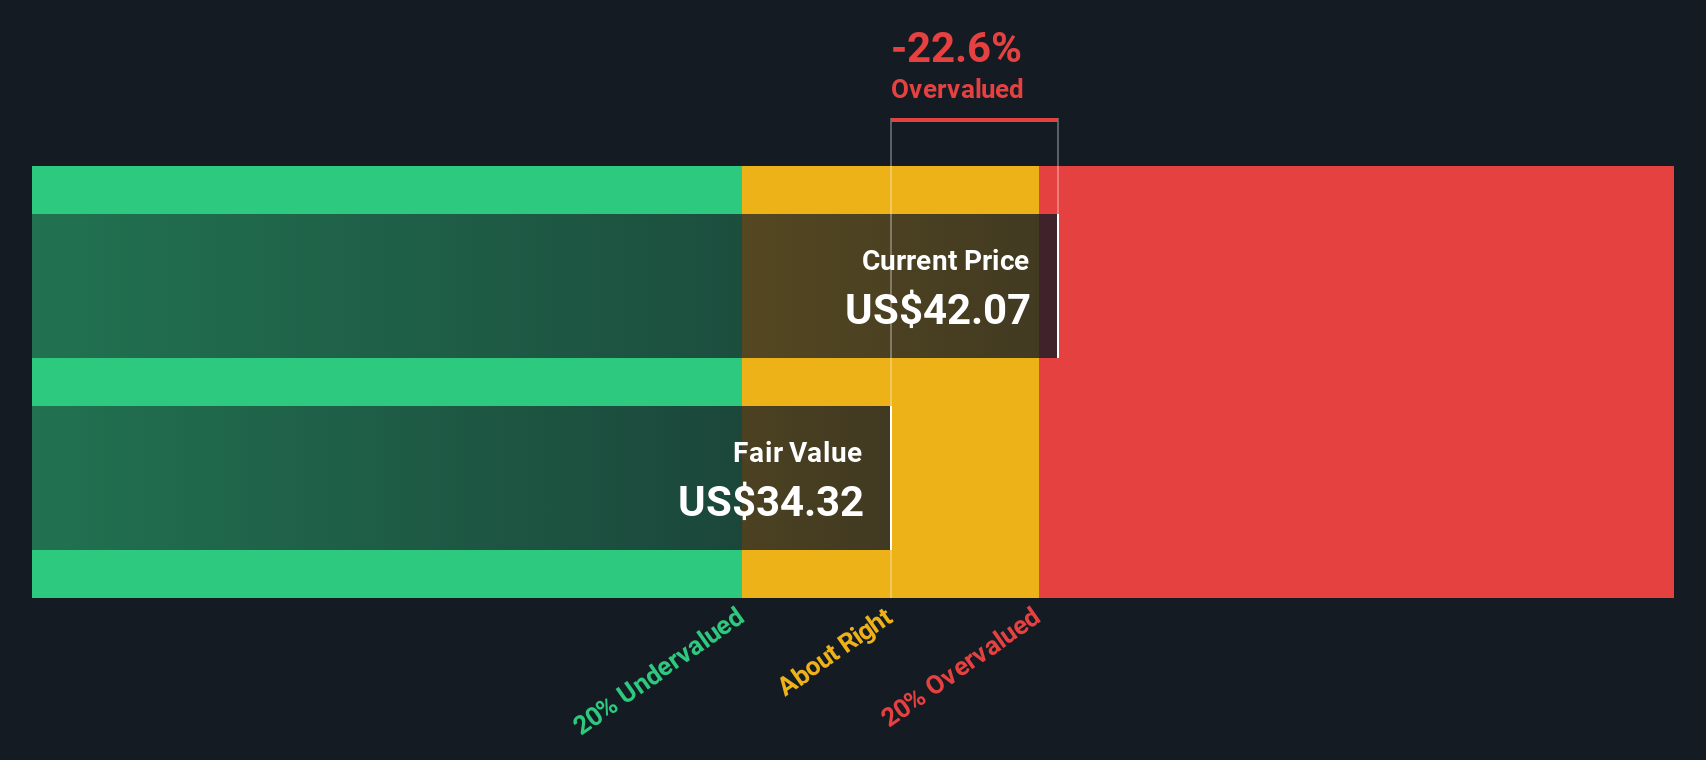
Across the ten year projection period, the discounted free cash flows range from about $247.2 million in 2026 to $235.8 million in 2035. When all of those discounted cash flows are added together, the model arrives at an estimated intrinsic value of roughly $30.79 per share.
Compared with the recent share price of US$37.20, the DCF output indicates the stock screens as about 20.8% above this estimate. On this cash flow based approach, Leonardo DRS appears expensive under the assumptions used in the model.
Result: OVERVALUED
Our Discounted Cash Flow (DCF) analysis suggests Leonardo DRS may be overvalued by 20.8%. Discover 885 undervalued stocks or create your own screener to find better value opportunities.
Approach 2: Leonardo DRS Price vs Earnings
For profitable companies, the P/E ratio is a useful yardstick because it links what you pay today to the earnings the business is already generating. You can think of it as a quick check on how many dollars investors are currently willing to pay for each dollar of profit.
What counts as a normal or fair P/E depends a lot on growth expectations and risk. Higher expected earnings growth or lower perceived risk can support a higher P/E, while slower growth or higher risk tends to justify a lower P/E.
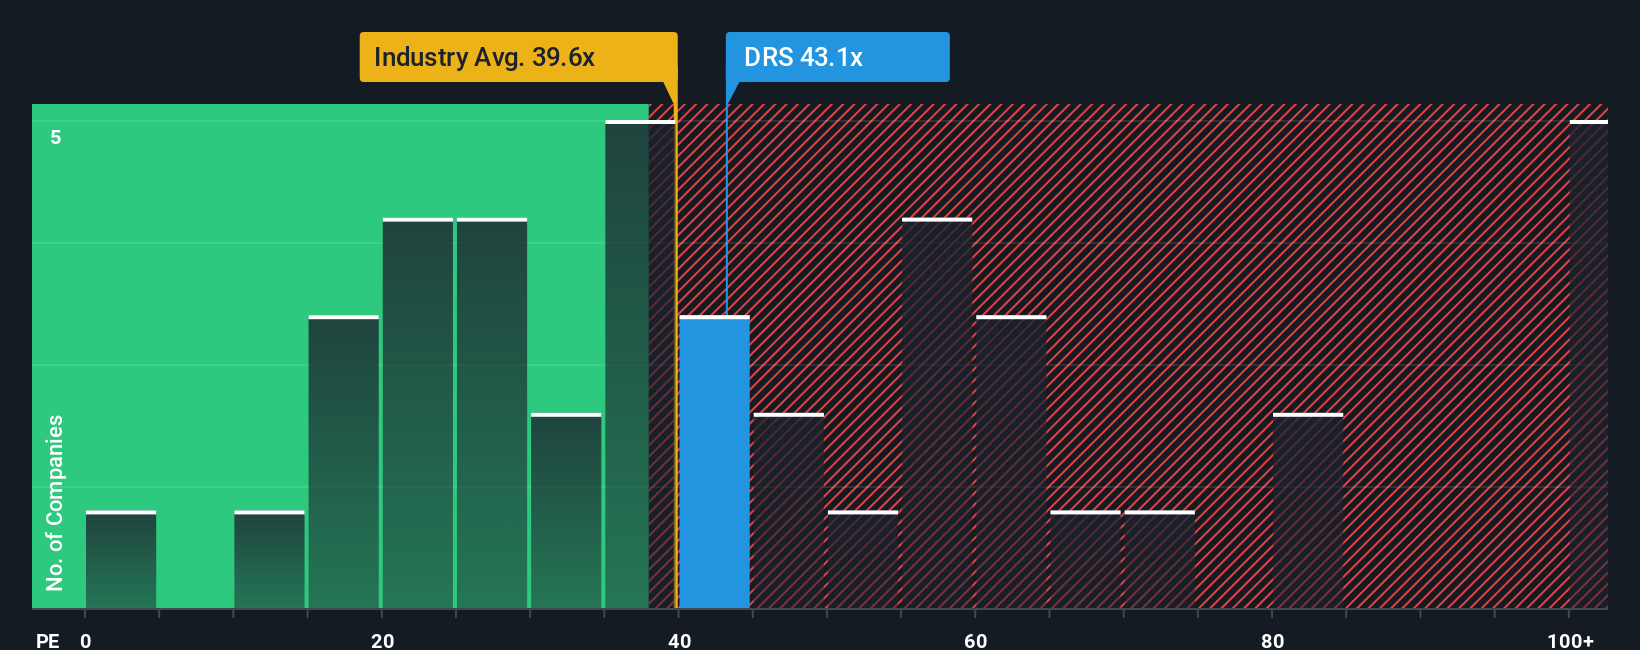
Leonardo DRS currently trades on a P/E of 37.34x. That is below the peer group average of 56.14x, and slightly below the Aerospace & Defense industry average of 40.43x. Simply Wall St also calculates a Fair Ratio of 26.18x, which is the P/E it would expect for Leonardo DRS after factoring in elements like earnings growth, its industry, profit margin, market cap and risk profile.
This Fair Ratio can be more informative than a simple peer or industry comparison because it adjusts for those company specific characteristics rather than assuming one size fits all. With the current P/E of 37.34x sitting above the Fair Ratio of 26.18x, the shares screen as overvalued on this earnings based approach.
Result: OVERVALUED
P/E ratios tell one story, but what if the real opportunity lies elsewhere? Discover 1450 companies where insiders are betting big on explosive growth.
Upgrade Your Decision Making: Choose your Leonardo DRS Narrative
Earlier we mentioned that there is an even better way to understand valuation, so let us introduce you to Narratives. These are simple stories you create about Leonardo DRS that link your view of its business, your forecast for revenue, earnings and margins, and your own fair value, all within an easy tool on Simply Wall St's Community page. Millions of investors use this to compare fair value to the current price, see in real time how new earnings or news adjust those numbers, and understand why one investor might see Leonardo DRS as worth US$47.30 based on assumptions like revenue of US$4.1b, earnings of US$351.1m and a future P/E of 47.2x by 2028, while another uses the same information with a different discount rate or profit margin view and arrives at a much lower fair value.
Do you think there's more to the story for Leonardo DRS? Head over to our Community to see what others are saying!

This article by Simply Wall St is general in nature. We provide commentary based on historical data and analyst forecasts only using an unbiased methodology and our articles are not intended to be financial advice. It does not constitute a recommendation to buy or sell any stock, and does not take account of your objectives, or your financial situation. We aim to bring you long-term focused analysis driven by fundamental data. Note that our analysis may not factor in the latest price-sensitive company announcements or qualitative material. Simply Wall St has no position in any stocks mentioned.
Have feedback on this article? Concerned about the content? Get in touch with us directly. Alternatively, email editorial-team@simplywallst.com