
- LIVE QUOTES
- LEARN
- HELP
 Nasdaq
 Wall Street Journal
EN
Is General Mills (GIS) Now Offering Value After A Steep One-Year Share Price Slide
- If you have ever wondered whether General Mills shares are starting to look interesting on price, this is a good moment to take a closer look at what the current market value actually gives you.
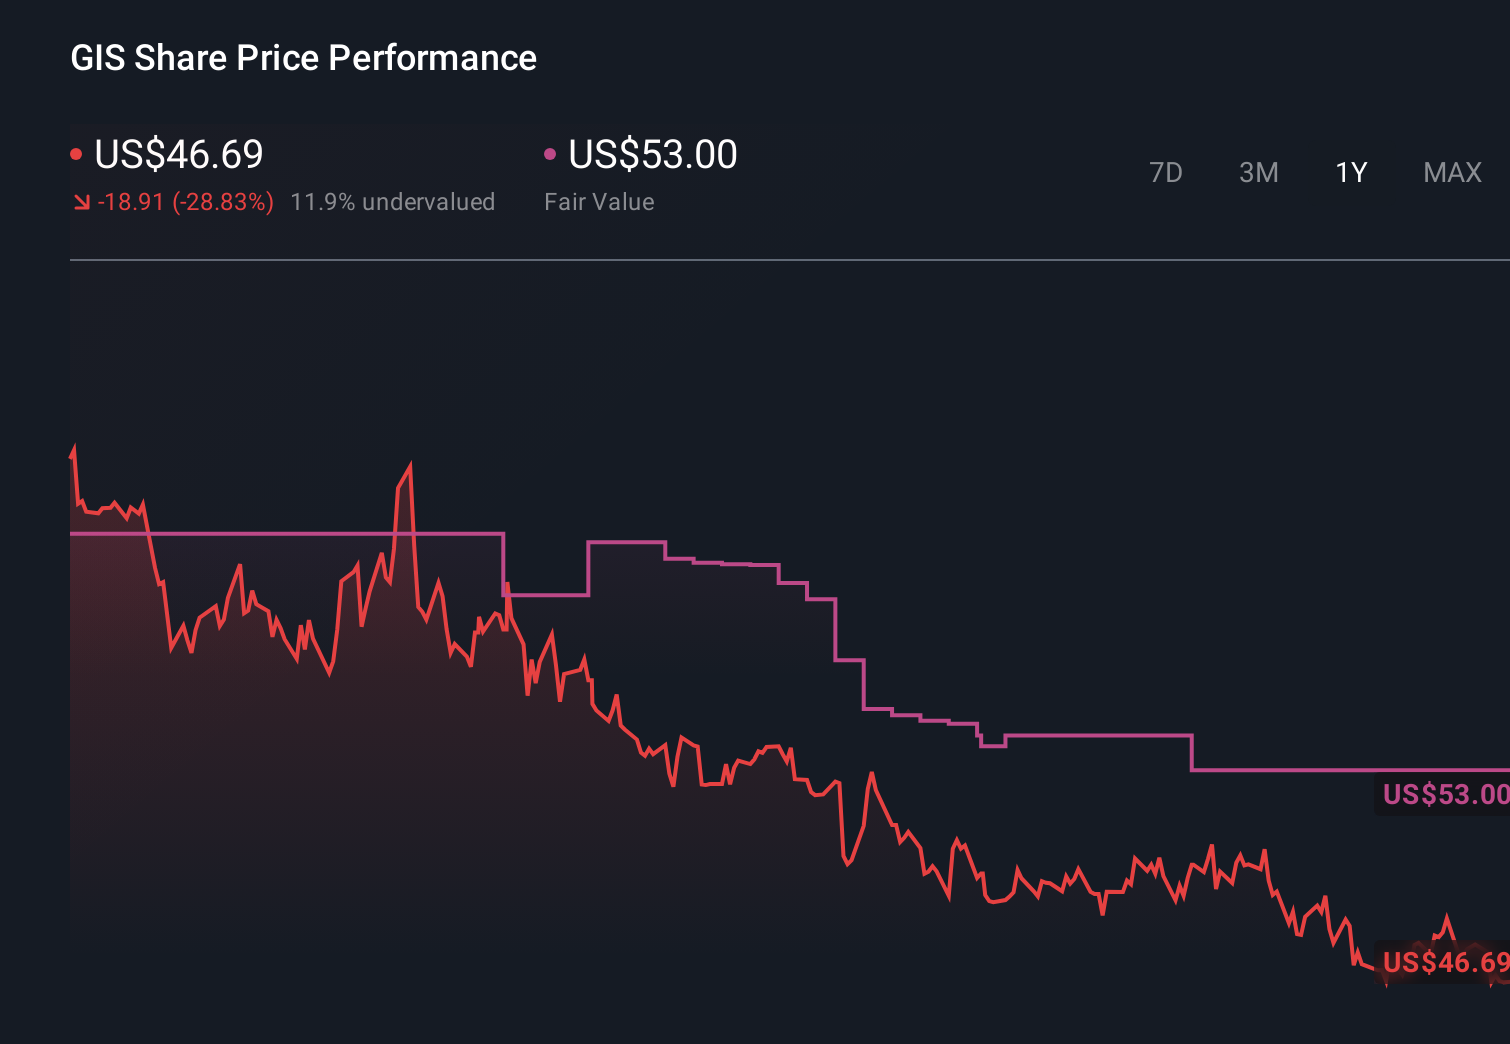
- The stock last closed at US$43.84, with returns of 6.1% decline over 7 days, 4.6% decline over 30 days, 4.1% decline year to date, 24.7% decline over 1 year, 42.1% decline over 3 years and 5.0% decline over 5 years, which may have some investors reassessing both risk and opportunity.
- Recent coverage around General Mills has focused on how a large, established food company is being priced by the market in light of changing consumer preferences and competition from private labels. Commentators have been asking whether the current share price reflects a cautious stance on future prospects or if it has moved beyond what recent developments justify.
- Our valuation checks give General Mills a score of 5/6, which suggests most of our tests flag the shares as undervalued and sets the scene to compare traditional valuation approaches with an even more holistic way of thinking about value later in this article.
Find out why General Mills's -24.7% return over the last year is lagging behind its peers.
Approach 1: General Mills Discounted Cash Flow (DCF) Analysis
A Discounted Cash Flow model takes the cash General Mills is expected to generate in the future, then discounts those amounts back to what they could be worth today. It is essentially asking what you might pay now for those projected future cash flows.
General Mills last reported trailing twelve month free cash flow of about $1.69b. Using a 2 Stage Free Cash Flow to Equity model, analysts and extrapolated estimates project annual free cash flows between $1.65b and about $2.88b over the next decade, with figures such as $1,645.70m in 2026 and $2,304m in 2029 forming part of the path toward that level. Simply Wall St uses analyst inputs for the nearer years and then extends the series using its own growth assumptions.
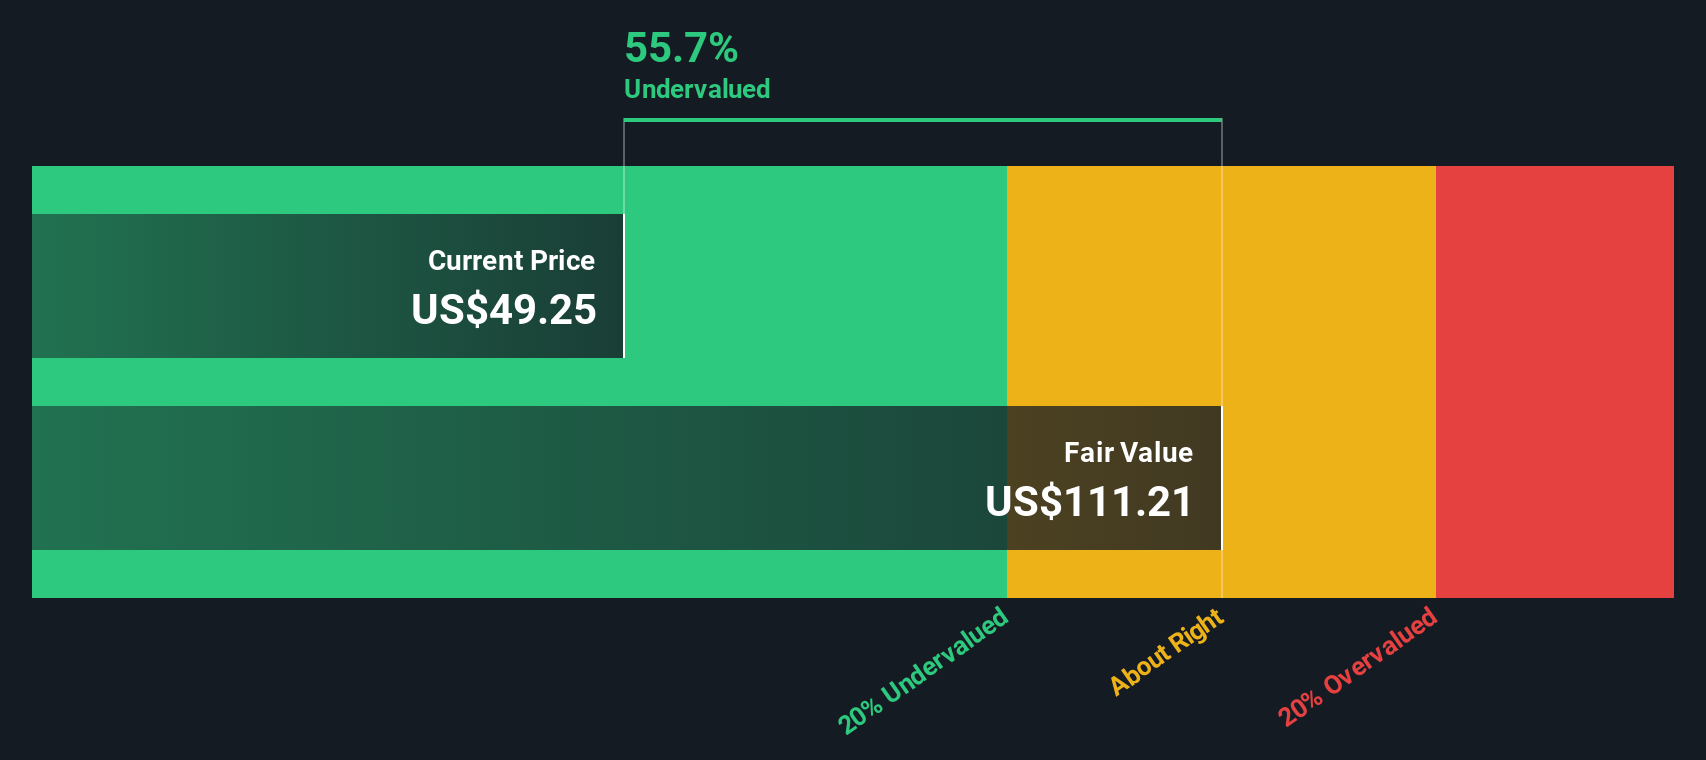
When those projected cash flows are discounted back, the model arrives at an estimated intrinsic value of about $107.79 per share. Compared with the recent share price of US$43.84, this implies a 59.3% discount, which screens as materially undervalued on this measure alone.
Result: UNDERVALUED
Our Discounted Cash Flow (DCF) analysis suggests General Mills is undervalued by 59.3%. Track this in your watchlist or portfolio, or discover 876 more undervalued stocks based on cash flows.
Approach 2: General Mills Price vs Earnings
For a profitable company like General Mills, the P/E ratio is a straightforward way to think about value because it links what you pay for each share to the earnings that each share represents today.
What counts as a “fair” P/E usually reflects how fast earnings are expected to grow and how risky those earnings are. Higher expected growth or lower perceived risk can justify a higher P/E, while slower growth or higher risk often comes with a lower P/E.
General Mills is currently trading on a P/E of 9.26x compared with the Food industry average of about 19.84x and a peer average of 24.64x. Simply Wall St also calculates a proprietary “Fair Ratio” for General Mills of 12.81x. This Fair Ratio is designed to be more tailored than a simple peer or industry comparison because it factors in elements such as the company’s earnings growth profile, profit margins, industry, market cap and specific risks.
With the current P/E of 9.26x below the Fair Ratio of 12.81x, this framework points to the shares being undervalued on an earnings multiple basis.
Result: UNDERVALUED
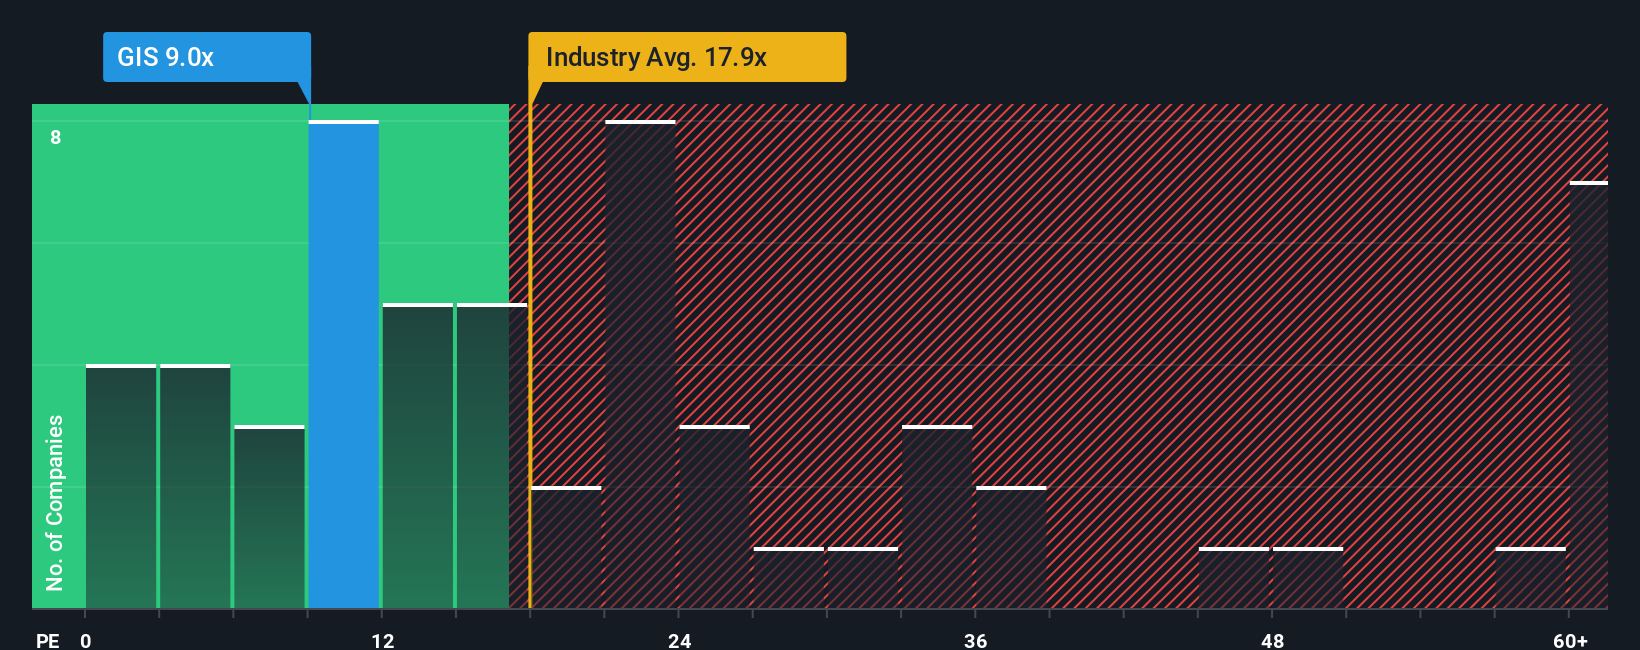
P/E ratios tell one story, but what if the real opportunity lies elsewhere? Discover 1450 companies where insiders are betting big on explosive growth.
Upgrade Your Decision Making: Choose your General Mills Narrative
Earlier we mentioned that there is an even better way to understand valuation, so let us introduce you to Narratives. These are simple stories you create about General Mills that connect your view of its future revenue, earnings and margins to a financial forecast, a fair value, and then to a clear comparison between that fair value and the current price. All of this is available within an easy tool on Simply Wall St's Community page that updates automatically when fresh news or earnings arrive. You can see, for example, one investor building a cautious General Mills Narrative around slower revenue, margin pressure from reinvestment and a fair value closer to US$45.00. Another might build a more optimistic Narrative that leans on reinvestment paying off, category recovery and a fair value closer to US$63.00. You can then decide for yourself how those stories line up with your own expectations before making any buy or sell decisions.
Do you think there's more to the story for General Mills? Head over to our Community to see what others are saying!
This article by Simply Wall St is general in nature. We provide commentary based on historical data and analyst forecasts only using an unbiased methodology and our articles are not intended to be financial advice. It does not constitute a recommendation to buy or sell any stock, and does not take account of your objectives, or your financial situation. We aim to bring you long-term focused analysis driven by fundamental data. Note that our analysis may not factor in the latest price-sensitive company announcements or qualitative material. Simply Wall St has no position in any stocks mentioned.
Have feedback on this article? Concerned about the content? Get in touch with us directly. Alternatively, email editorial-team@simplywallst.com