
- LIVE QUOTES
- LEARN
- HELP
 Nasdaq
 Wall Street Journal
EN
Assessing Xylem (XYL) Valuation As Strong Q4 Profit Growth Forecasts Meet A Slight Price Target Trim
Xylem (XYL) is back in focus as investors look ahead to its upcoming fiscal fourth quarter 2025 earnings report, with analysts projecting profit of $1.41 per diluted share, which implies 19.5% growth.
See our latest analysis for Xylem.
The recent 1 day share price return of 1.68% and 7 day share price return of 2.72% put Xylem at US$141.33, although the 90 day share price return of 4.63% suggests momentum has cooled, while the 1 year total shareholder return of 23.53% points to a stronger longer term trend.
If Xylem’s earnings outlook has you reviewing water related names, this could be a good moment to widen your search with healthcare stocks as a contrasting defensive corner of the market.
With Xylem trading near US$141 and sitting only around 1% below one estimate of intrinsic value, plus a roughly 18% gap to the average analyst price target, you have to ask: is there real upside left here, or is the market already assuming future growth?
Most Popular Narrative: 16% Undervalued
With Xylem last closing at US$141.33 against a narrative fair value of about US$167.41, the gap raises clear questions about what assumptions sit underneath.
The company's operational simplification and implementation of the 80/20 model is already delivering record on-time performance, increased productivity, and measurable margin improvements, signaling sustainable cost efficiencies and enhanced net margins moving forward.
Curious what has to happen on revenue, earnings and long term margins to support that higher value, and why the projected P/E leans above industry norms?
Result: Fair Value of $167.41 (UNDERVALUED)
Have a read of the narrative in full and understand what's behind the forecasts.
However, there are still pressure points, such as weaker orders in China and funding delays for water projects, that could challenge those margin and earnings assumptions.
Find out about the key risks to this Xylem narrative.
Another View: Valuation Tension From Earnings Multiples
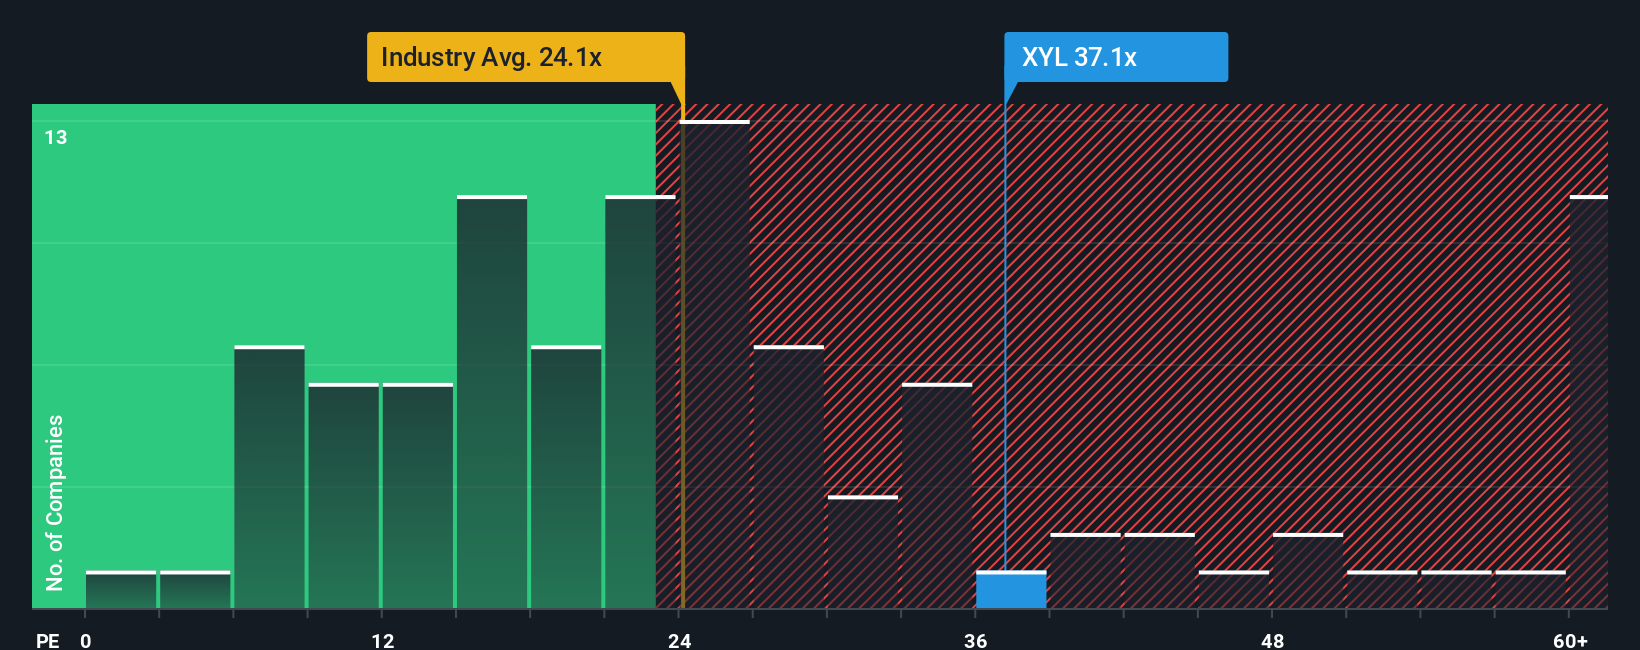
While the fair value narrative points to Xylem as slightly undervalued, the earnings multiple tells a tighter story. The shares trade on a P/E of 36.3x, compared with a fair ratio of 28.1x, the US Machinery industry at 25.4x and peers at 32.8x. This implies investors are already paying a premium. The question is whether Xylem’s earnings profile justifies that extra stretch, or if it leaves less room for error.
See what the numbers say about this price — find out in our valuation breakdown.
Build Your Own Xylem Narrative
If you see the numbers differently or prefer to weigh the assumptions yourself, you can build a custom view in just a few minutes with Do it your way.
A great starting point for your Xylem research is our analysis highlighting 3 key rewards and 1 important warning sign that could impact your investment decision.
Ready for more investment ideas?
If Xylem has sharpened your thinking, do not stop here. Broaden your watchlist with curated sets of companies that match different styles and themes.
- Target potential mispricings by reviewing these 877 undervalued stocks based on cash flows that might be trading below what their cash flows suggest.
- Ride powerful technology trends by scanning these 26 AI penny stocks that are tied to artificial intelligence growth stories.
- Put income at the center of your plan by focusing on these 11 dividend stocks with yields > 3% that already offer yields above 3%.
This article by Simply Wall St is general in nature. We provide commentary based on historical data and analyst forecasts only using an unbiased methodology and our articles are not intended to be financial advice. It does not constitute a recommendation to buy or sell any stock, and does not take account of your objectives, or your financial situation. We aim to bring you long-term focused analysis driven by fundamental data. Note that our analysis may not factor in the latest price-sensitive company announcements or qualitative material. Simply Wall St has no position in any stocks mentioned.
Have feedback on this article? Concerned about the content? Get in touch with us directly. Alternatively, email editorial-team@simplywallst.com