
- LIVE QUOTES
- LEARN
- HELP
 Nasdaq
 Wall Street Journal
EN
Is Legend Biotech (LEGN) Pricing Reflect Recent 37.5% Share Price Slide And DCF Upside Potential
- If you are wondering whether Legend Biotech shares are pricing in too much hope or not enough, you are in the right place for a clear look at what you are actually paying for.
- The stock last closed at US$20.98, with returns of a 2.6% decline over 7 days, a 25.4% decline over 30 days, and a 37.5% decline over 1 year, which can change how investors think about both its growth potential and its risk.
- Recent coverage has focused on Legend Biotech's position in cell therapy, its partnerships with larger pharmaceutical peers, and updates around its product pipeline. All of these factors help frame the recent moves in the share price and provide important context for judging whether the current price still lines up with the underlying business.
- On our valuation checklist, Legend Biotech scores a 4 out of 6. Next we will walk through what that means using several standard valuation methods, before finishing with a more joined-up way to think about value that ties everything together.
Find out why Legend Biotech's -37.5% return over the last year is lagging behind its peers.
Approach 1: Legend Biotech Discounted Cash Flow (DCF) Analysis
A Discounted Cash Flow, or DCF, model takes estimates of the cash a business might generate in the future and discounts those cash flows back to today, so you can compare them with the current share price.
For Legend Biotech, the model used is a 2 Stage Free Cash Flow to Equity framework based on free cash flow in US dollars. The latest twelve month free cash flow is a loss of $203.2m. Analysts have provided free cash flow estimates out to 2028, such as $226.1m in 2026 and $866.3m in 2028, and Simply Wall St extrapolates these further, with projected free cash flow of $1.1b by 2035.
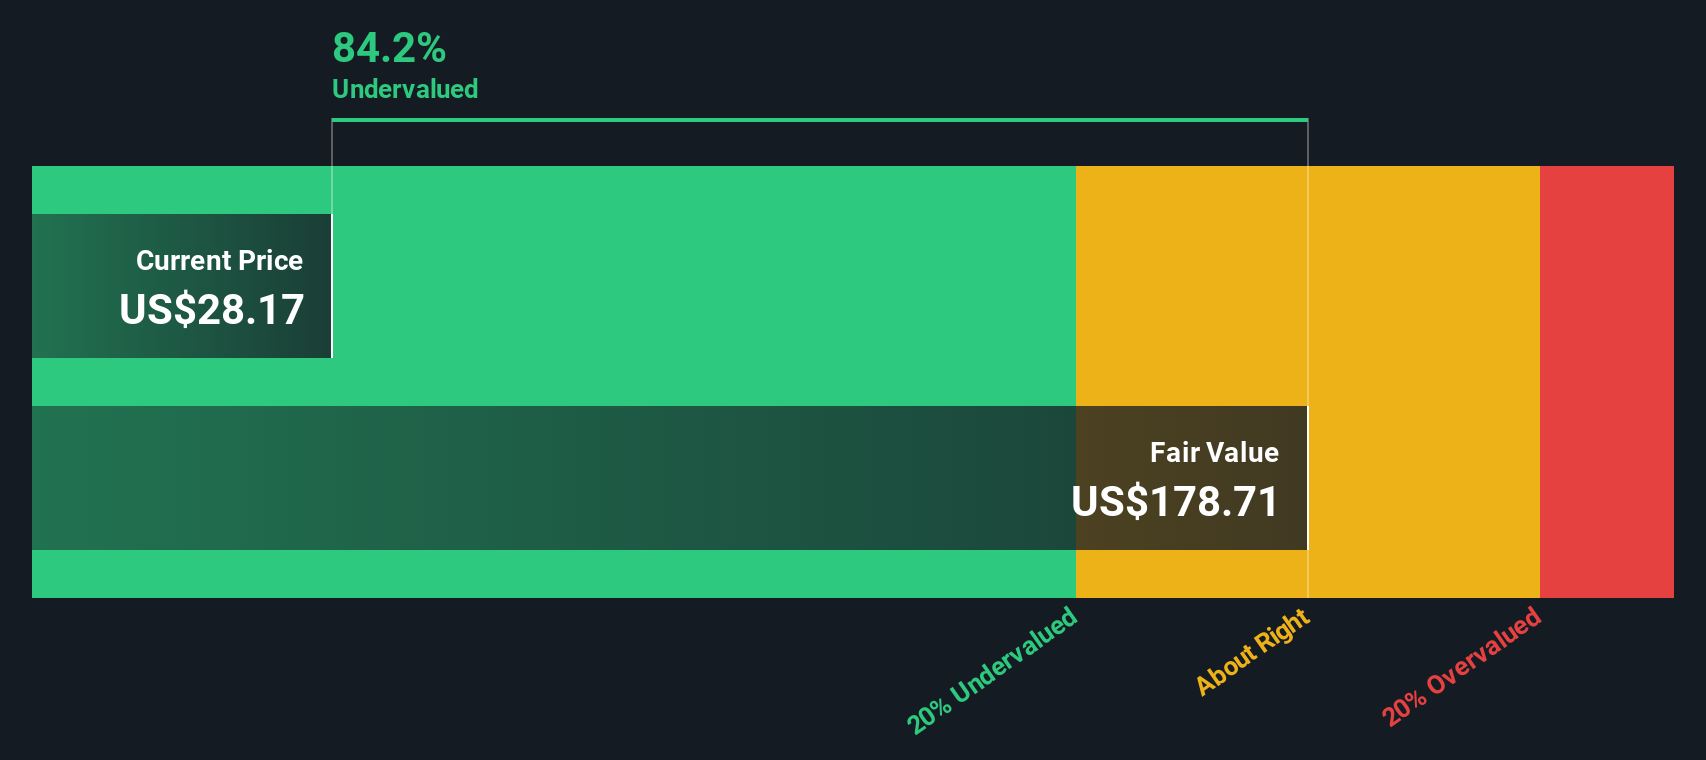
When all those future cash flows are discounted back, the model arrives at an estimated intrinsic value of US$123.01 per share. Compared with the recent share price of US$20.98, the DCF output implies the stock is about 82.9% undervalued on this set of assumptions.
Result: UNDERVALUED
Our Discounted Cash Flow (DCF) analysis suggests Legend Biotech is undervalued by 82.9%. Track this in your watchlist or portfolio, or discover 877 more undervalued stocks based on cash flows.
Approach 2: Legend Biotech Price vs Sales
For a company that is still building toward consistent profitability, the Price to Sales, or P/S, ratio is often a useful way to think about what you are paying for each dollar of revenue, without relying on earnings that can be heavily affected by research and development or one off items.
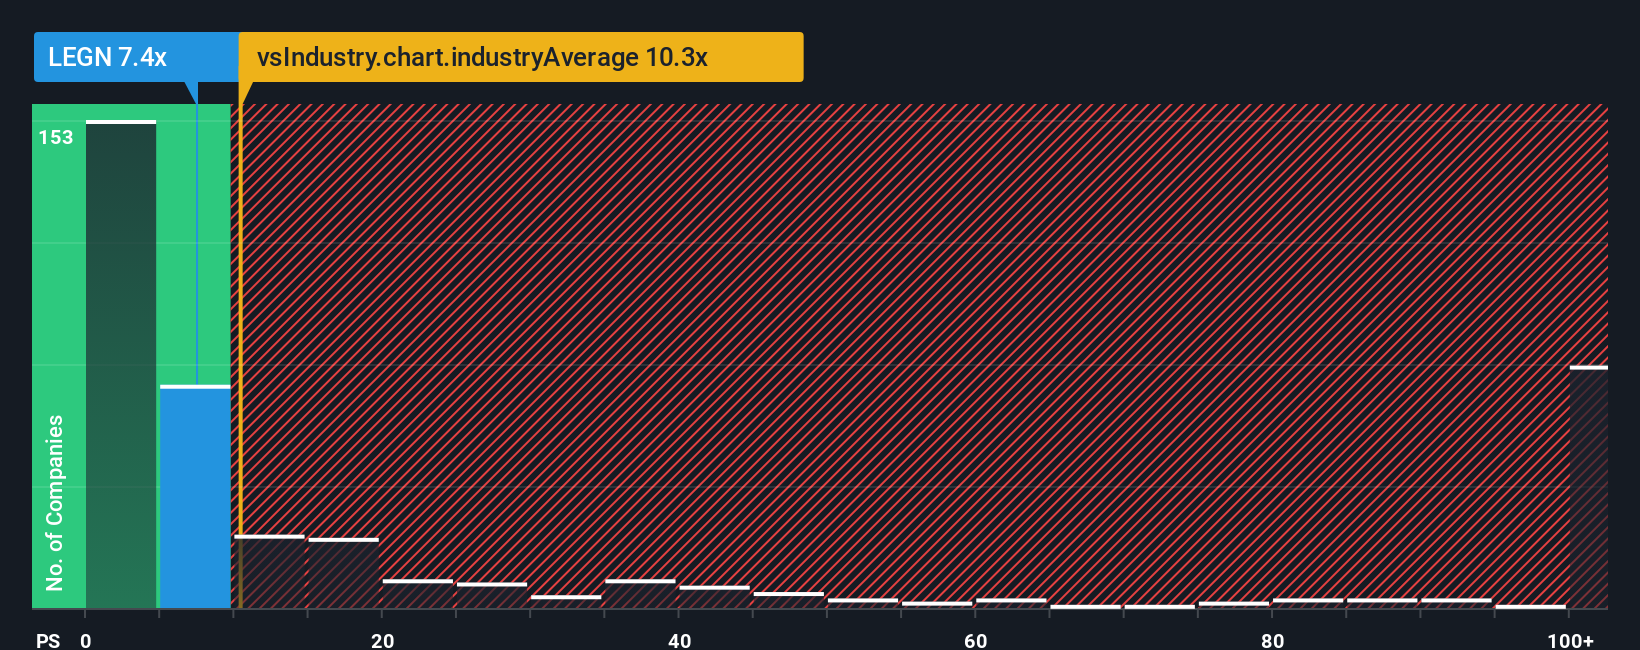
In general, higher expected growth and lower perceived risk can justify a higher “normal” P/S ratio. Slower growth or higher uncertainty can point to a lower one. Legend Biotech currently trades on a P/S of 4.26x. That sits below the Biotechs industry average of 11.66x and also below the peer group average of 11.00x.
Simply Wall St’s Fair Ratio for Legend Biotech is 4.10x. This is a proprietary estimate of what a reasonable P/S might be given factors such as the company’s earnings growth profile, industry, profit margins, market cap and key risks. Because it is tailored to the company, it can be more informative than a simple comparison with broad industry or peer averages.
With the current P/S of 4.26x sitting slightly above the Fair Ratio of 4.10x, the shares screen as mildly overvalued on this metric.
Result: OVERVALUED
P/S ratios tell one story, but what if the real opportunity lies elsewhere? Discover 1448 companies where insiders are betting big on explosive growth.
Upgrade Your Decision Making: Choose your Legend Biotech Narrative
Earlier we mentioned that there is an even better way to understand valuation, so let us introduce you to Narratives. This is where you set out your story for Legend Biotech, link it to your own revenue, earnings and margin assumptions, see the fair value that falls out of that forecast, then compare it with the current price to decide whether the stock looks attractive or expensive. All of this is available within an easy tool on Simply Wall St’s Community page that updates as new news or earnings arrive. One investor might, for example, build a Narrative around a higher fair value closer to US$94, while another anchors on a more cautious view nearer US$54, with both perspectives clearly tied to their underlying numbers.
Do you think there's more to the story for Legend Biotech? Head over to our Community to see what others are saying!

This article by Simply Wall St is general in nature. We provide commentary based on historical data and analyst forecasts only using an unbiased methodology and our articles are not intended to be financial advice. It does not constitute a recommendation to buy or sell any stock, and does not take account of your objectives, or your financial situation. We aim to bring you long-term focused analysis driven by fundamental data. Note that our analysis may not factor in the latest price-sensitive company announcements or qualitative material. Simply Wall St has no position in any stocks mentioned.
Have feedback on this article? Concerned about the content? Get in touch with us directly. Alternatively, email editorial-team@simplywallst.com