
- LIVE QUOTES
- LEARN
- HELP
 Nasdaq
 Wall Street Journal
EN
A Look At Cincinnati Financial (CINF) Valuation After Recent Mixed Share Price Momentum
Cincinnati Financial (CINF) has recently drawn attention after a mixed set of return figures, with the stock roughly flat over the month but showing a negative move across the past 3 months.
See our latest analysis for Cincinnati Financial.
At the current share price of $162.12, Cincinnati Financial’s recent 3 month share price return of a 2.07% decline contrasts with a 1 year total shareholder return of 16.55% and 5 year total shareholder return of 98.38%. This suggests that longer term momentum remains stronger even as shorter term sentiment has cooled.
If this insurance stock’s mixed momentum has you thinking about where else capital might work harder, it could be a good moment to broaden your search with fast growing stocks with high insider ownership.
With Cincinnati Financial’s strong multi year shareholder returns, modest recent share price weakness, and a current price of $162.12 that is below the average analyst target of $174.67, is there still a buying opportunity or is future growth already priced in?
Most Popular Narrative Narrative: 6.1% Undervalued
The most followed narrative puts Cincinnati Financial’s fair value at about $172.67 per share, compared with the last close of $162.12, and ties that gap to specific long term earnings assumptions.
In order for you to agree with the analyst's consensus, you would need to believe that by 2028, revenues will be $13.2 billion, earnings will be $1.2 billion, and the shares would be trading on a PE ratio of 26.5x, assuming you use a discount rate of 6.8%.
Curious how modest revenue growth, thinner margins and a much higher future earnings multiple still line up to support that valuation gap? The full narrative explains the trade off between slower profit trends and a richer P/E that underpins this fair value estimate, along with the cash flow path needed to reach that level.
Result: Fair Value of $172.67 (UNDERVALUED)
Have a read of the narrative in full and understand what's behind the forecasts.
However, this hinges on forecasts that could be challenged if catastrophe losses rise materially, or if competitive pressures and regulation squeeze underwriting margins more than expected.
Find out about the key risks to this Cincinnati Financial narrative.
Another View: SWS DCF Flags Limited Upside
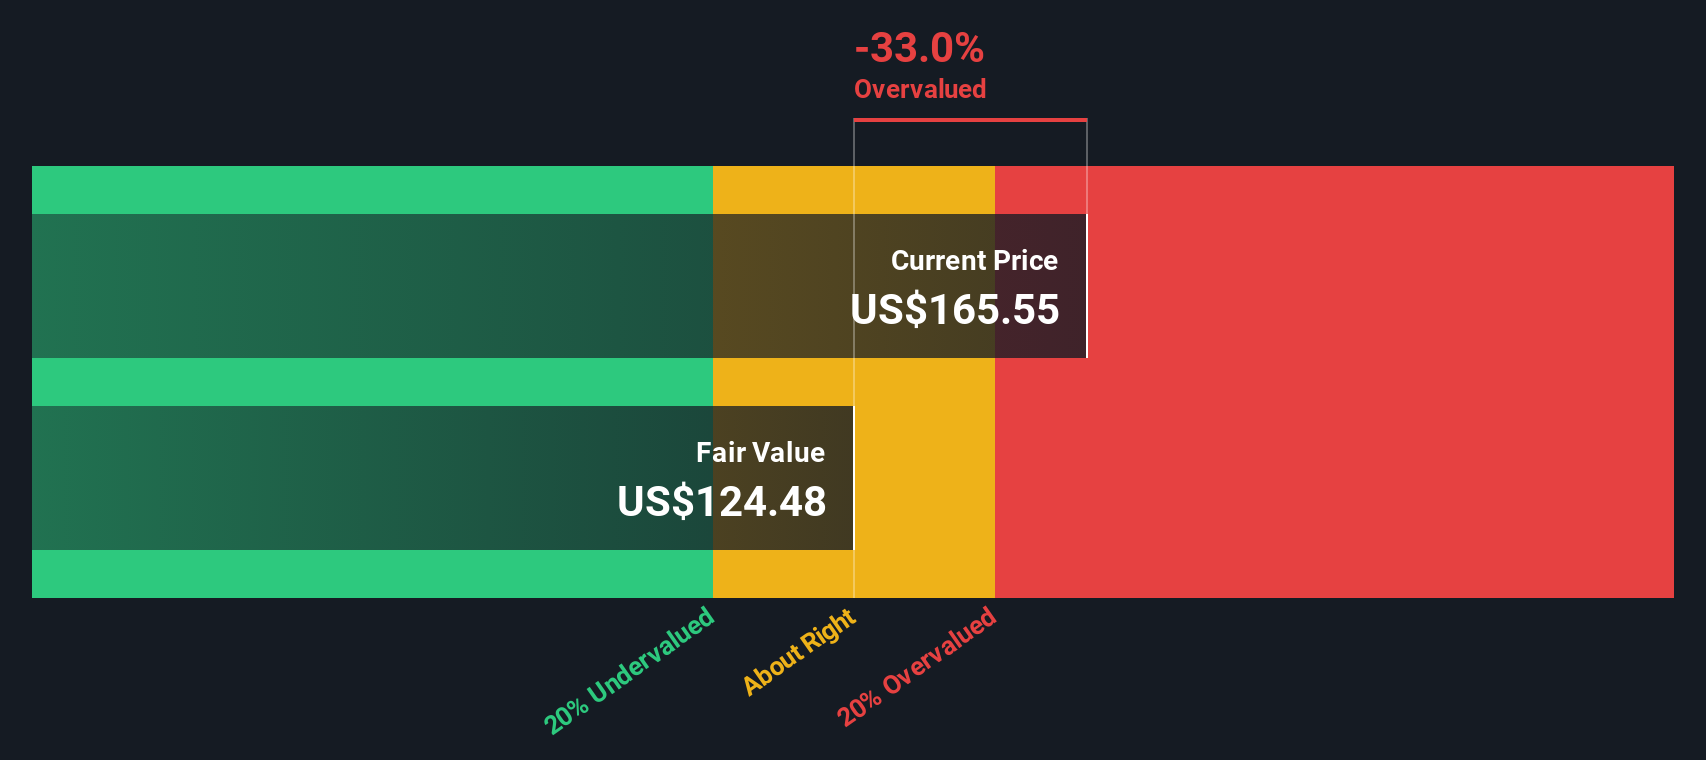
Our DCF model tells a different story to the popular 6.1% undervalued narrative. On this view, Cincinnati Financial’s estimated fair value is about $147.89 per share, compared with the current $162.12 price, which screens as overvalued rather than cheap.
That gap suggests less of a margin of safety if earnings or catastrophe losses end up closer to the more cautious forecasts, rather than the optimistic narrative assumptions. It leaves you with a simple question: which set of expectations feels closer to how this insurer will really perform?
Look into how the SWS DCF model arrives at its fair value.
Simply Wall St performs a discounted cash flow (DCF) on every stock in the world every day (check out Cincinnati Financial for example). We show the entire calculation in full. You can track the result in your watchlist or portfolio and be alerted when this changes, or use our stock screener to discover 877 undervalued stocks based on their cash flows. If you save a screener we even alert you when new companies match - so you never miss a potential opportunity.
Build Your Own Cincinnati Financial Narrative
If you look at these assumptions and feel they miss something, you can stress test the numbers yourself and shape a custom view in minutes with Do it your way.
A great starting point for your Cincinnati Financial research is our analysis highlighting 2 key rewards and 2 important warning signs that could impact your investment decision.
Looking for more investment ideas?
If you stop with just one stock, you could miss out on opportunities that fit your style better, so put a few more ideas on your radar today.
- Spot potential bargains early by scanning these 877 undervalued stocks based on cash flows that may offer more appealing prices relative to their fundamentals.
- Ride major shifts in technology by checking out these 25 AI penny stocks shaping how artificial intelligence reaches everyday products and services.
- Tap into fast moving themes by reviewing these 79 cryptocurrency and blockchain stocks that are tied to blockchain, digital payments and new forms of transaction infrastructure.
This article by Simply Wall St is general in nature. We provide commentary based on historical data and analyst forecasts only using an unbiased methodology and our articles are not intended to be financial advice. It does not constitute a recommendation to buy or sell any stock, and does not take account of your objectives, or your financial situation. We aim to bring you long-term focused analysis driven by fundamental data. Note that our analysis may not factor in the latest price-sensitive company announcements or qualitative material. Simply Wall St has no position in any stocks mentioned.
Have feedback on this article? Concerned about the content? Get in touch with us directly. Alternatively, email editorial-team@simplywallst.com