
- LIVE QUOTES
- LEARN
- HELP
 Nasdaq
 Wall Street Journal
EN
Is Wixcom (WIX) Pricing Reflect A 54% One Year Share Price Decline
- For investors considering whether Wix.com is attractively priced at its recent levels, or whether the market is already pricing in too much optimism, this article focuses squarely on what you are getting for the price you pay.
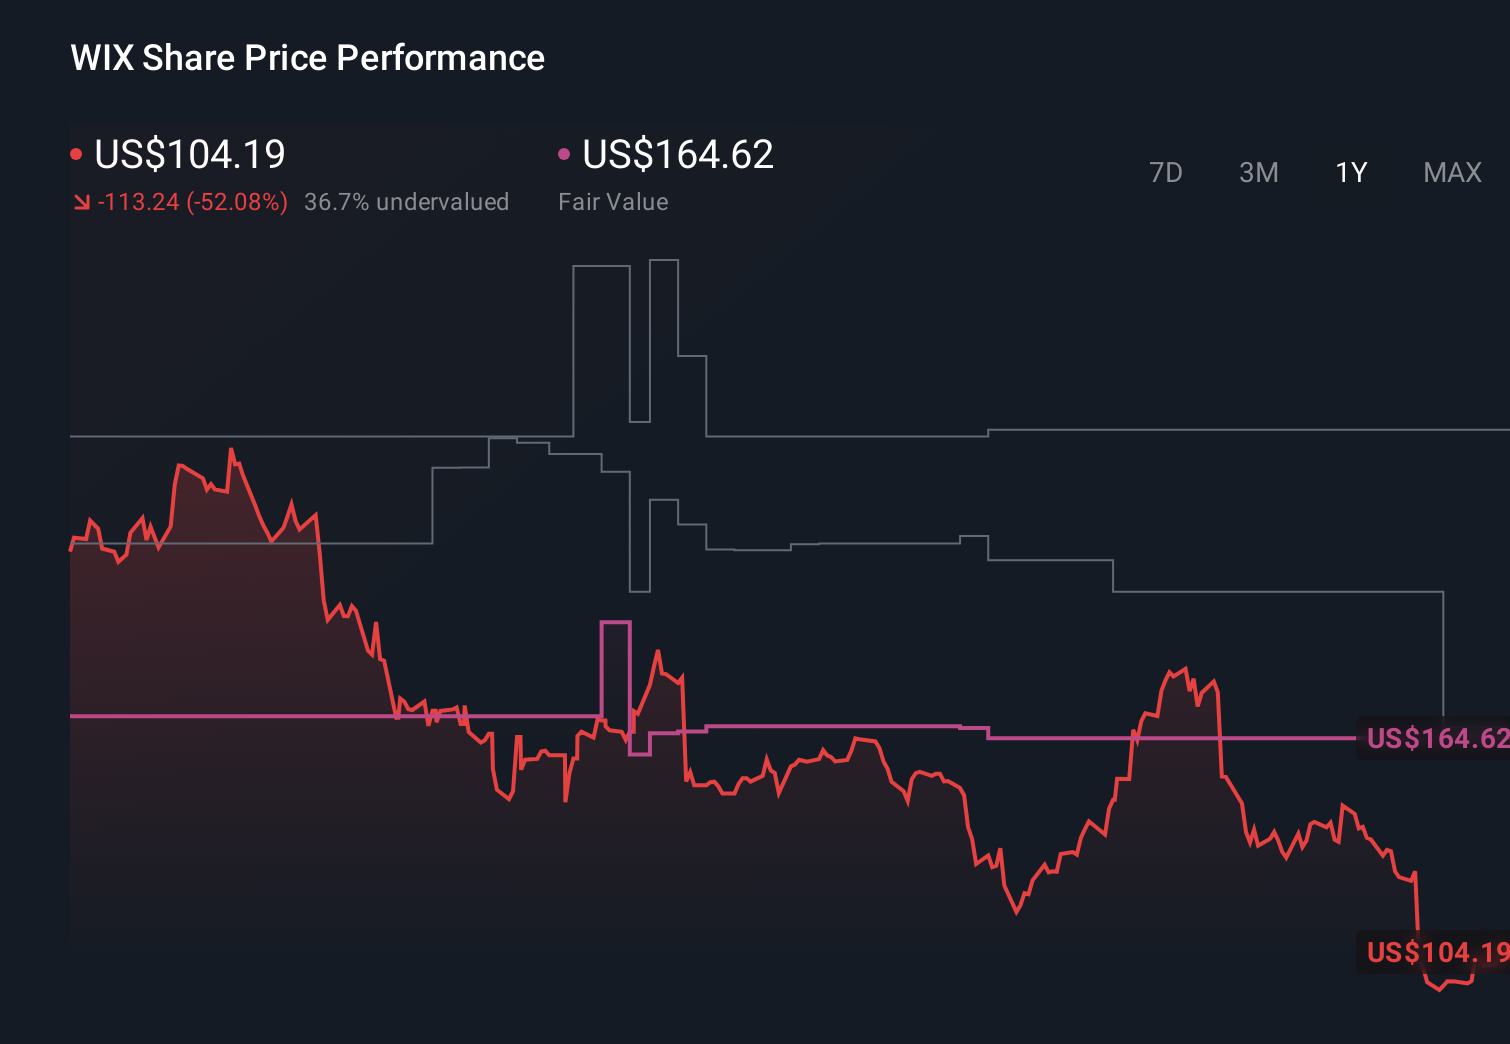
- The stock most recently closed at US$101.25, with returns of a 2.1% decline over 7 days, 1.0% over 30 days, 0.3% year to date, a 54.1% decline over 1 year and a 61.2% decline over 5 years. This raises questions about how risk and potential reward are currently being weighed.
- Recent coverage of Wix.com has focused on how the business fits into the wider software and website building space, and how investors are reacting to that positioning. This context matters because sentiment around the sector and the company often shows up first in the share price and only later in valuation metrics.
- On our checks, Wix.com scores a 3 out of 6 valuation score, which suggests a mixed picture that calls for a closer look at different methods such as multiples and cash flow models. We will also touch on a broader way of thinking about value at the end of the article.
Find out why Wix.com's -54.1% return over the last year is lagging behind its peers.
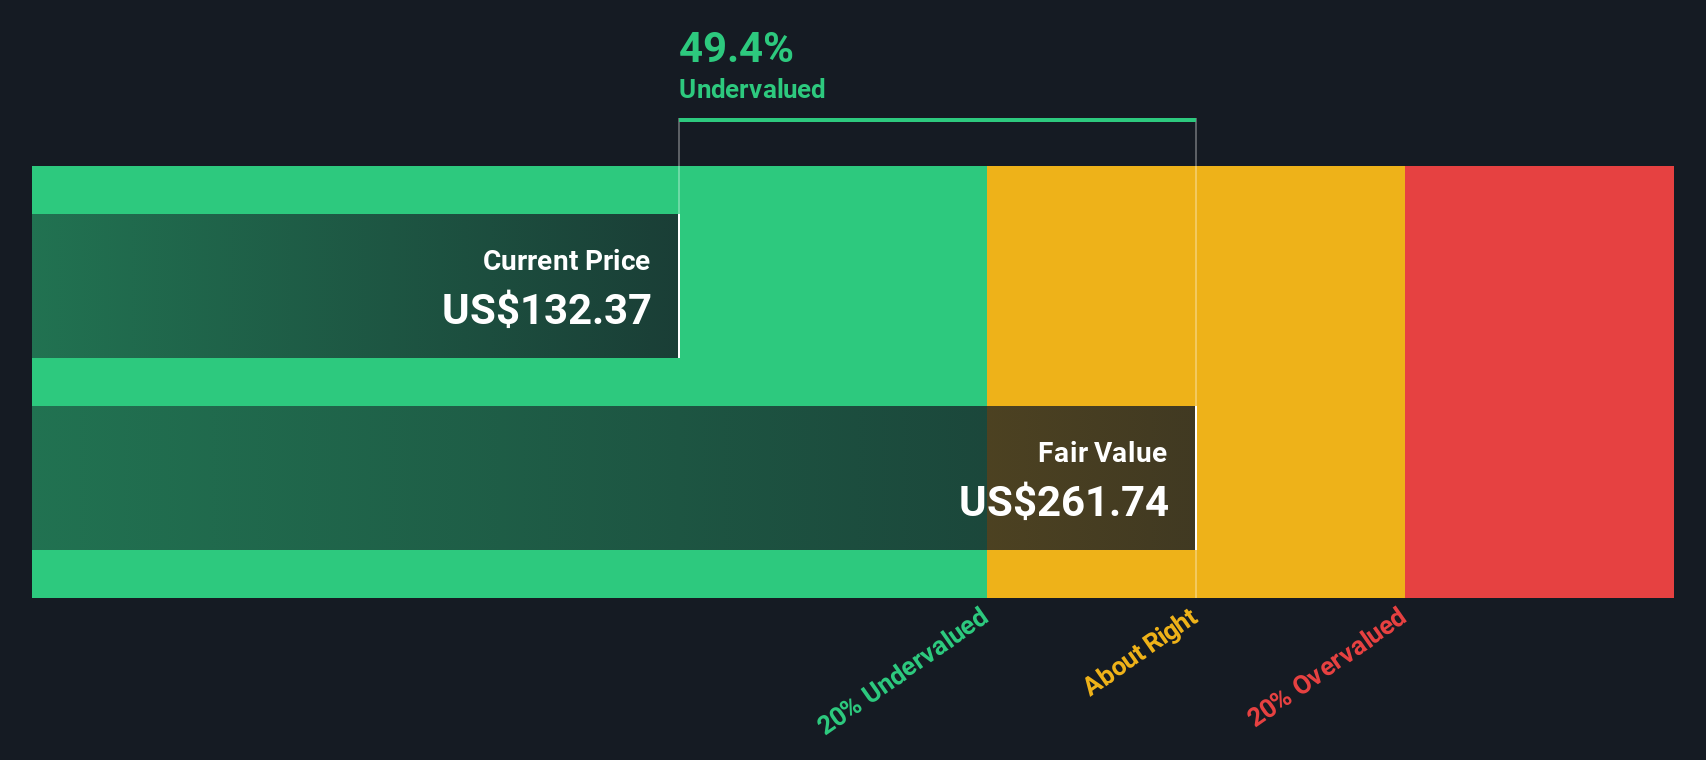
Approach 1: Wix.com Discounted Cash Flow (DCF) Analysis
A Discounted Cash Flow model projects a company’s future cash flows and then discounts those cash flows back to today’s dollars, aiming to estimate what the entire business could be worth right now.
For Wix.com, the model used is a 2 Stage Free Cash Flow to Equity approach. The latest twelve month free cash flow is reported at about $518.1 million. Analysts and extrapolated estimates point to free cash flow of $576.4 million in 2026 and $890.9 million by 2030, all in $. These yearly projections are discounted back using the DCF method and then summed to arrive at an estimated value for the equity.
On this basis, the model produces an intrinsic value of about $156.93 per share for Wix.com, compared with the recent share price of $101.25. This implies an intrinsic discount of roughly 35.5%, which indicates the shares are trading meaningfully below this DCF estimate.
Result: UNDERVALUED
Our Discounted Cash Flow (DCF) analysis suggests Wix.com is undervalued by 35.5%. Track this in your watchlist or portfolio, or discover 877 more undervalued stocks based on cash flows.
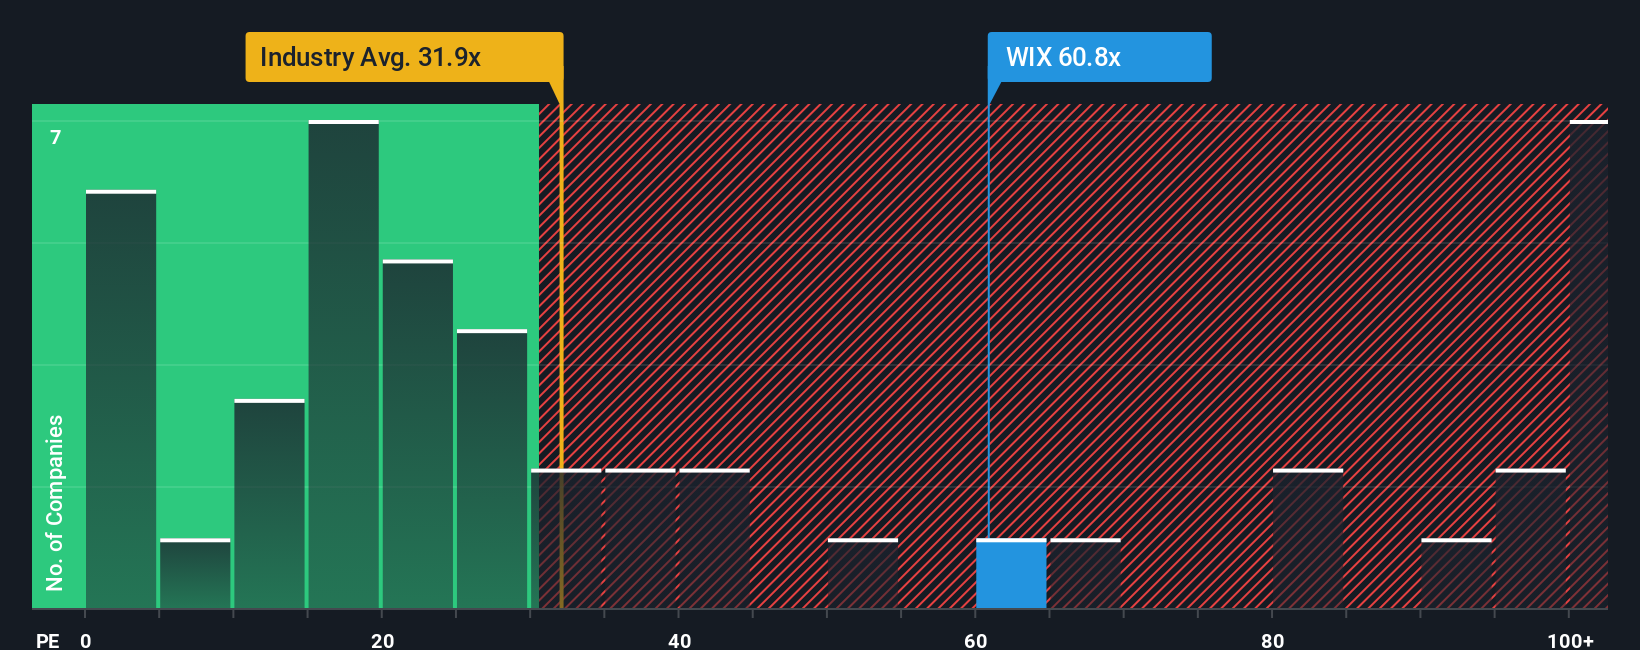
Approach 2: Wix.com Price vs Earnings
For profitable companies, the P/E ratio is a useful way to relate what you pay for a share to the earnings the business is currently generating. It gives you a quick sense of how many years of current earnings are implied in the price.
What counts as a “normal” P/E depends on how the market views a company’s growth prospects and risk. Higher expected growth and lower perceived risk usually support a higher P/E, while slower growth or higher risk tend to justify a lower one.
Wix.com is trading on a P/E of 39.87x. That sits above the wider IT industry average of 30.48x, but slightly below the peer group average of 43.04x. To sharpen this view, Simply Wall St uses a proprietary “Fair Ratio”, which estimates what P/E might be reasonable for Wix.com given its earnings growth profile, industry, profit margins, market value and risk factors. For Wix.com, this Fair Ratio is 36.08x.
This Fair Ratio can be more informative than a simple comparison with peers or the industry because it adjusts for company specific characteristics instead of assuming that all IT stocks should trade on the same multiple. On this basis, Wix.com’s current P/E of 39.87x is a little higher than the Fair Ratio of 36.08x, which points to the shares trading somewhat above this metric.
Result: OVERVALUED
P/E ratios tell one story, but what if the real opportunity lies elsewhere? Discover 1448 companies where insiders are betting big on explosive growth.
Upgrade Your Decision Making: Choose your Wix.com Narrative
Earlier we mentioned that there is an even better way to understand valuation. Let us introduce Narratives, which let you write a simple story about Wix.com that ties your view of its business into a financial forecast and a Fair Value. You can incorporate factors such as how AI tools, Base44, user growth, competition and regulation might shape revenue, earnings and margins. The Simply Wall St platform, on the Community page used by millions of investors, can then compare this Fair Value to the current share price and update it automatically when news or earnings arrive. One investor might plug in more optimistic assumptions that support a Fair Value around US$255, while another uses more cautious assumptions closer to US$160, and each can see in real time whether the current price looks high or low compared to their own story driven view.
Do you think there's more to the story for Wix.com? Head over to our Community to see what others are saying!
This article by Simply Wall St is general in nature. We provide commentary based on historical data and analyst forecasts only using an unbiased methodology and our articles are not intended to be financial advice. It does not constitute a recommendation to buy or sell any stock, and does not take account of your objectives, or your financial situation. We aim to bring you long-term focused analysis driven by fundamental data. Note that our analysis may not factor in the latest price-sensitive company announcements or qualitative material. Simply Wall St has no position in any stocks mentioned.
Have feedback on this article? Concerned about the content? Get in touch with us directly. Alternatively, email editorial-team@simplywallst.com