
- LIVE QUOTES
- LEARN
- HELP
 Nasdaq
 Wall Street Journal
EN
Is It Too Late To Consider FedEx (FDX) After Recent Share Price Strength?
- If you are wondering whether FedEx shares still offer value at current levels, this article will walk through what the numbers are saying about the stock.
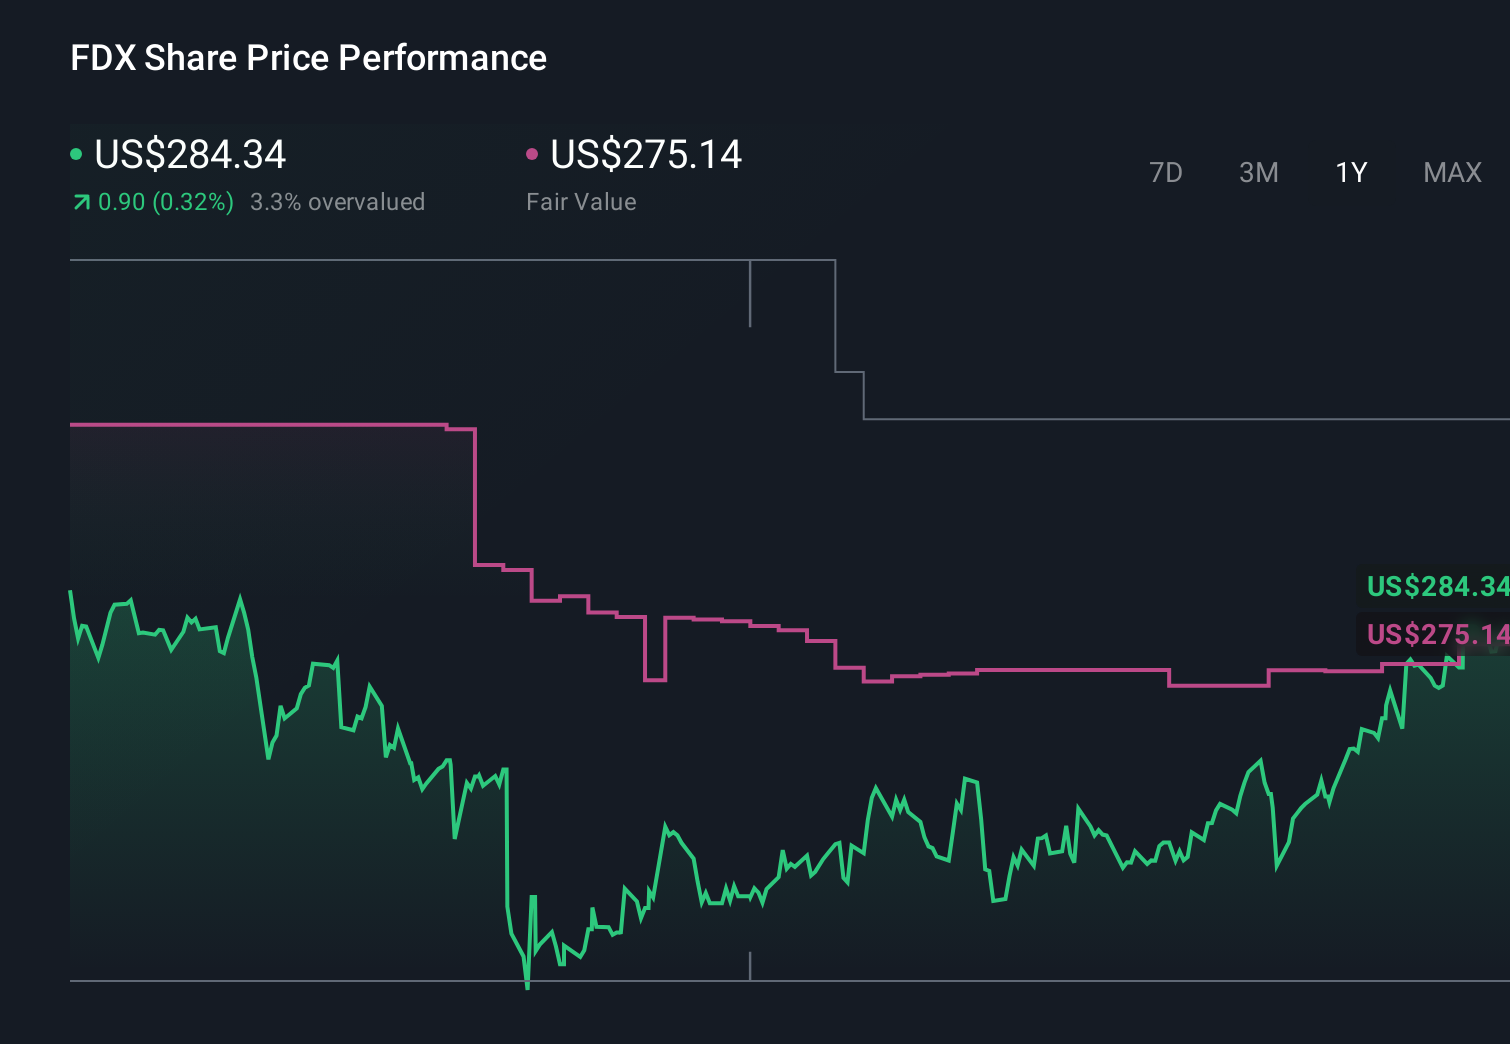
- FedEx last closed at US$307.93, with returns of 5.8% over 7 days, 12.3% over 30 days, 5.0% year to date, 14.6% over 1 year, 74.0% over 3 years and 36.1% over 5 years. This naturally raises questions about how much of the story is already reflected in the price.
- Recent news flow around FedEx has focused on how parcel volumes, cost efficiency efforts and the broader demand backdrop could influence its long-term outlook. Together with ongoing discussion about competition and global trade trends, this gives useful context for thinking about why the share price has moved the way it has.
- On our checklist-based valuation framework, FedEx currently has a valuation score of 2 out of 6. Next we will break down what different valuation approaches suggest about the stock today and then finish with a simple way to bring those methods together into one clearer view of value.
FedEx scores just 2/6 on our valuation checks. See what other red flags we found in the full valuation breakdown.
Approach 1: FedEx Discounted Cash Flow (DCF) Analysis
A Discounted Cash Flow, or DCF, model estimates what a company might be worth by projecting its future cash flows and discounting them back to today in dollar terms. In this case, the model used is a 2 Stage Free Cash Flow to Equity approach, which focuses on cash available to shareholders after expenses and investments.
FedEx most recently reported free cash flow of about $3.57b. Analyst and extrapolated projections supplied to the model run out over the coming decade, with estimated free cash flow of around $5.16b in 2035. Simply Wall St uses analyst forecasts where available for the earlier years, then extends the series using more modest growth assumptions for later years.
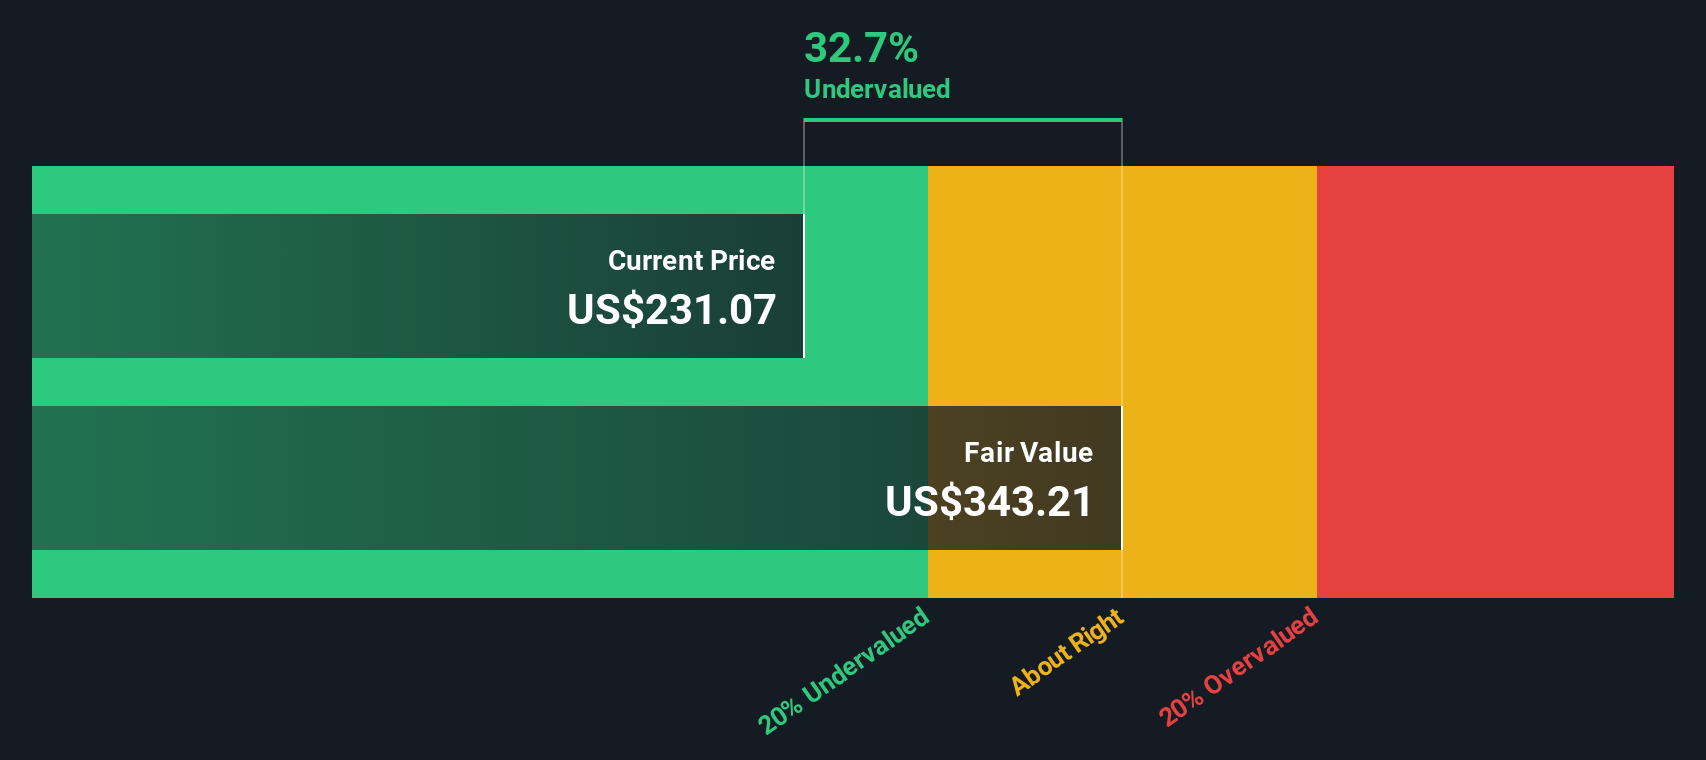
After discounting those projected cash flows, the model arrives at an estimated intrinsic value of about US$292.71 per share. Compared with the recent share price of US$307.93, the DCF implies the stock is around 5.2% overvalued. This is a relatively small gap and suggests the market price is close to the model’s assessment.
Result: ABOUT RIGHT
FedEx is fairly valued according to our Discounted Cash Flow (DCF), but this can change at a moment's notice. Track the value in your watchlist or portfolio and be alerted on when to act.
Approach 2: FedEx Price vs Earnings
For a profitable company like FedEx, the P/E ratio is a useful way to gauge how much investors are paying for each dollar of earnings. It links what you see on the income statement directly to the share price, which makes comparisons relatively straightforward.
What counts as a "normal" P/E depends on what the market expects and how risky those earnings appear. Higher expected growth or lower perceived risk can support a higher multiple, while slower growth or higher uncertainty can point to a lower one.
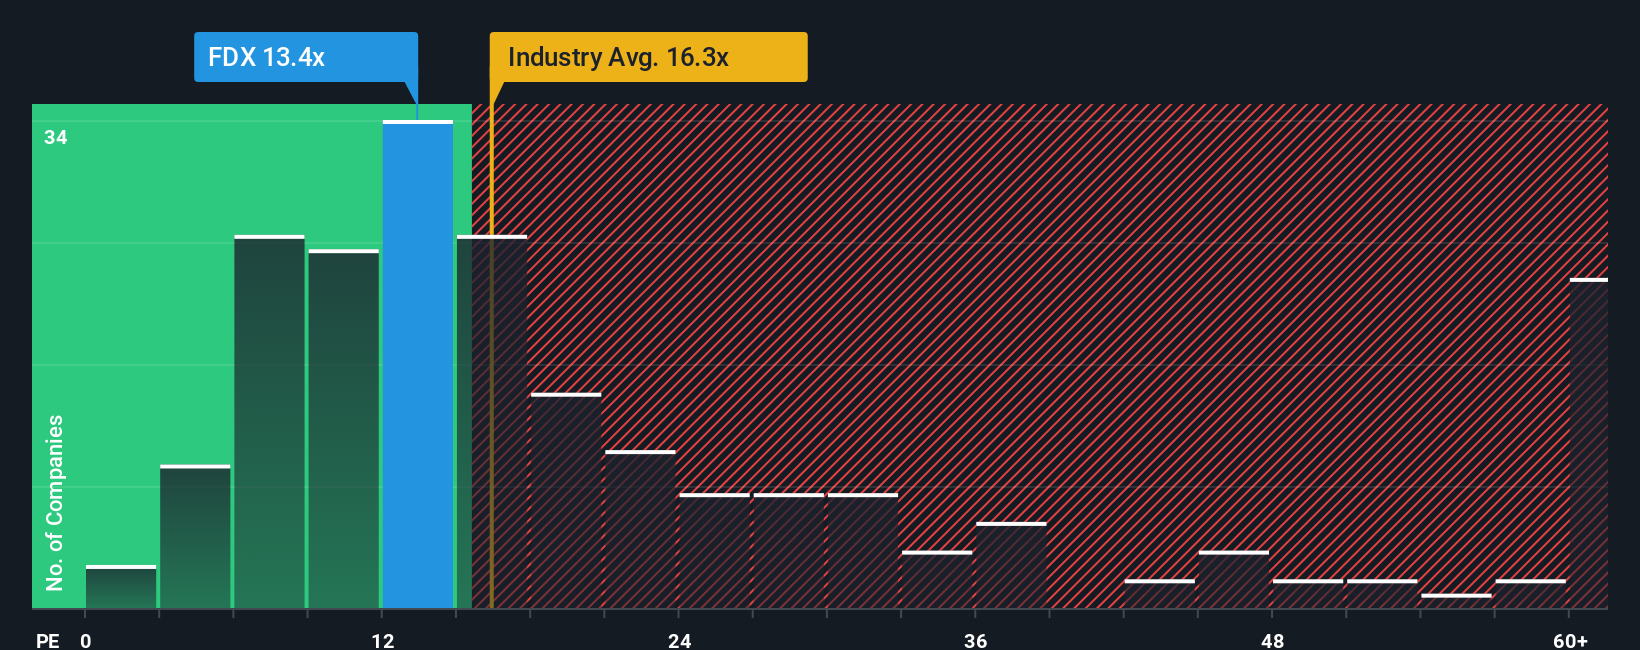
FedEx currently trades on a P/E of 16.72x. That sits close to the broader logistics industry average of about 16.23x, and below the peer group average of 21.96x. Simply Wall St also calculates a Fair Ratio for FedEx of 20.05x. This Fair Ratio is a proprietary estimate of what the P/E might be given factors such as earnings growth profile, profit margins, industry, market cap and risk characteristics.
Unlike a simple comparison with peers or the industry, the Fair Ratio tries to adjust for company specific traits rather than assuming all logistics stocks should trade on the same multiple. Comparing FedEx’s current P/E of 16.72x with the Fair Ratio of 20.05x suggests the shares screen as undervalued on this metric.
Result: UNDERVALUED
P/E ratios tell one story, but what if the real opportunity lies elsewhere? Discover 1449 companies where insiders are betting big on explosive growth.
Upgrade Your Decision Making: Choose your FedEx Narrative
Earlier we mentioned that there is an even better way to understand valuation. On Simply Wall St’s Community page you can use Narratives, where you write the story you believe about FedEx, link that story to your own revenue, earnings and margin forecasts, see the fair value that falls out of those numbers, and then compare it to the current price to help inform decisions. The fair value updates as new news or earnings arrive. One investor might plug in assumptions similar to the most bullish analyst, with a fair value around US$320 per share. Another might lean closer to the most cautious view near US$200. Narratives simply make those different viewpoints clear, consistent and easy to track.
Do you think there's more to the story for FedEx? Head over to our Community to see what others are saying!
This article by Simply Wall St is general in nature. We provide commentary based on historical data and analyst forecasts only using an unbiased methodology and our articles are not intended to be financial advice. It does not constitute a recommendation to buy or sell any stock, and does not take account of your objectives, or your financial situation. We aim to bring you long-term focused analysis driven by fundamental data. Note that our analysis may not factor in the latest price-sensitive company announcements or qualitative material. Simply Wall St has no position in any stocks mentioned.
Have feedback on this article? Concerned about the content? Get in touch with us directly. Alternatively, email editorial-team@simplywallst.com