
- LIVE QUOTES
- LEARN
- HELP
 Nasdaq
 Wall Street Journal
EN
Is Insmed (INSM) Pricing Reflect A 165% One Year Surge And DCF Upside Potential
- If you are wondering whether Insmed's share price still lines up with its fundamentals, you are not alone; this article will walk through what the current valuation might be telling you.
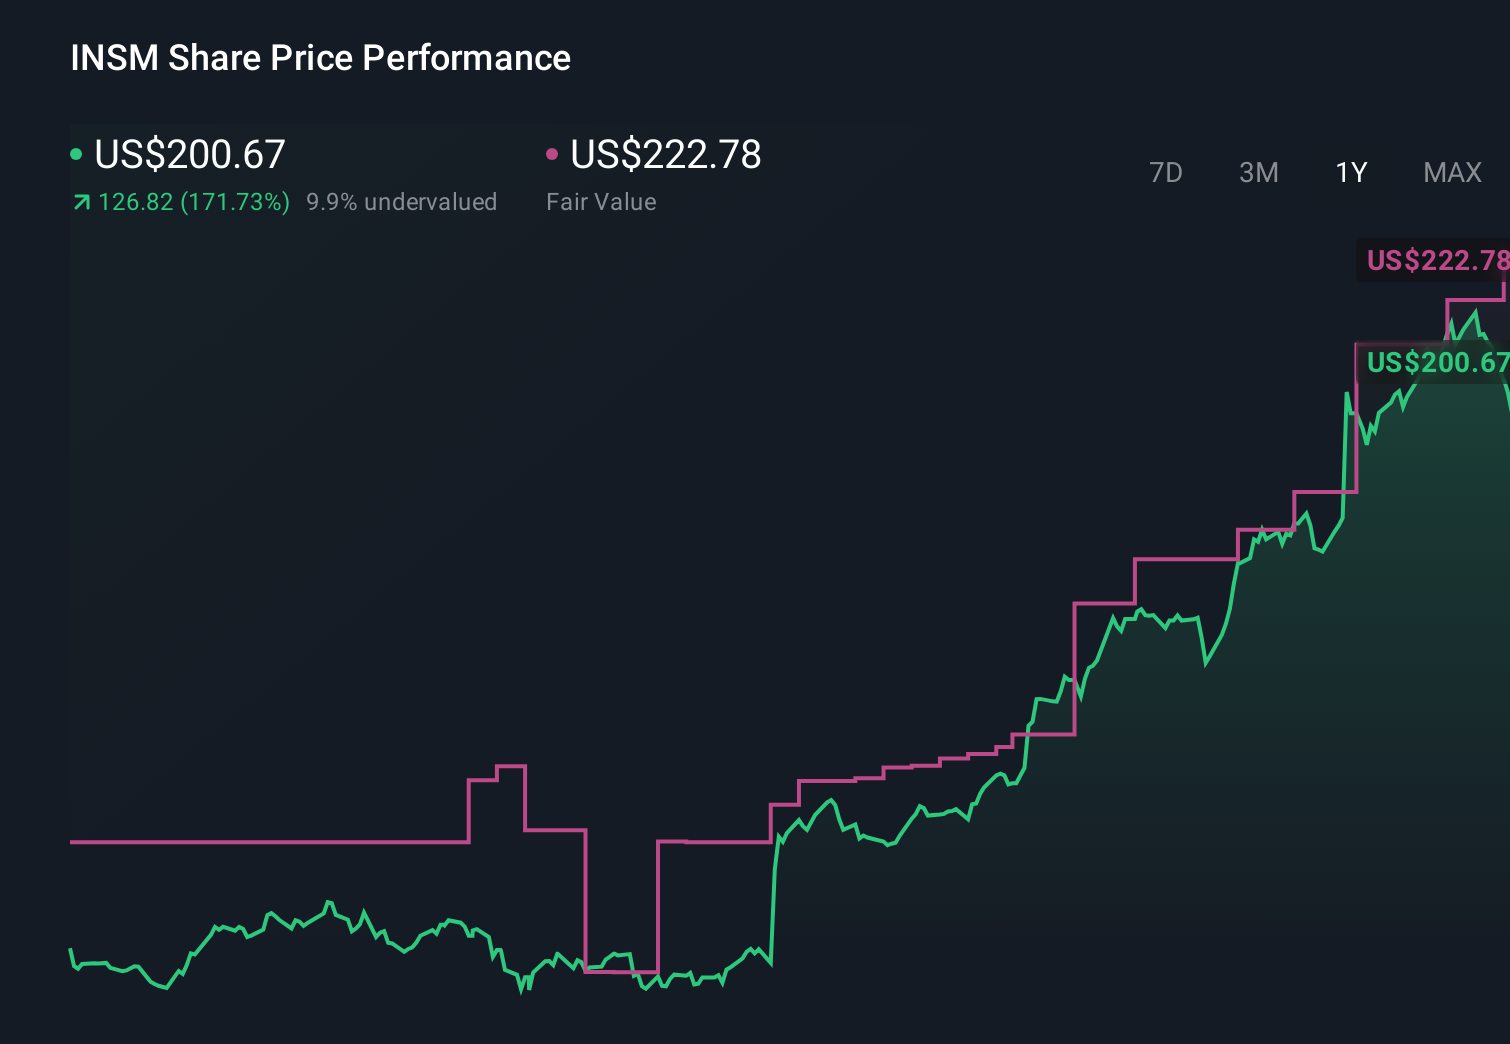
- The stock last closed at US$175.07, after a 0.6% gain over 7 days, a 14.2% decline over 30 days, a 1.2% decline year to date, a 164.8% gain over 1 year, and a very large return over 3 years and 5 years.
- Recent share price moves have drawn extra attention to what is driving sentiment around Insmed and why expectations have shifted over different time frames. This context matters when you later compare current pricing to measures like cash flows, assets, or peer group multiples.
- On our simple valuation checklist, Insmed scores 4 out of 6 for being undervalued, and next we will walk through what that means across different valuation methods before finishing with a way to tie those numbers into a clearer long term story.
Approach 1: Insmed Discounted Cash Flow (DCF) Analysis
A Discounted Cash Flow model takes estimates of a company’s future cash flows and then discounts them back to today’s dollars, which gives you an estimate of what the entire business could be worth right now.
For Insmed, the latest twelve month free cash flow is a loss of $906.7 million. Analysts have provided cash flow estimates for the next few years, and Simply Wall St then extends those projections further using its 2 Stage Free Cash Flow to Equity model. Within this framework, free cash flow is projected to reach $2,285.5 million in 2030, with intermediate years moving from losses into positive territory based on the supplied schedule of ten year projections.
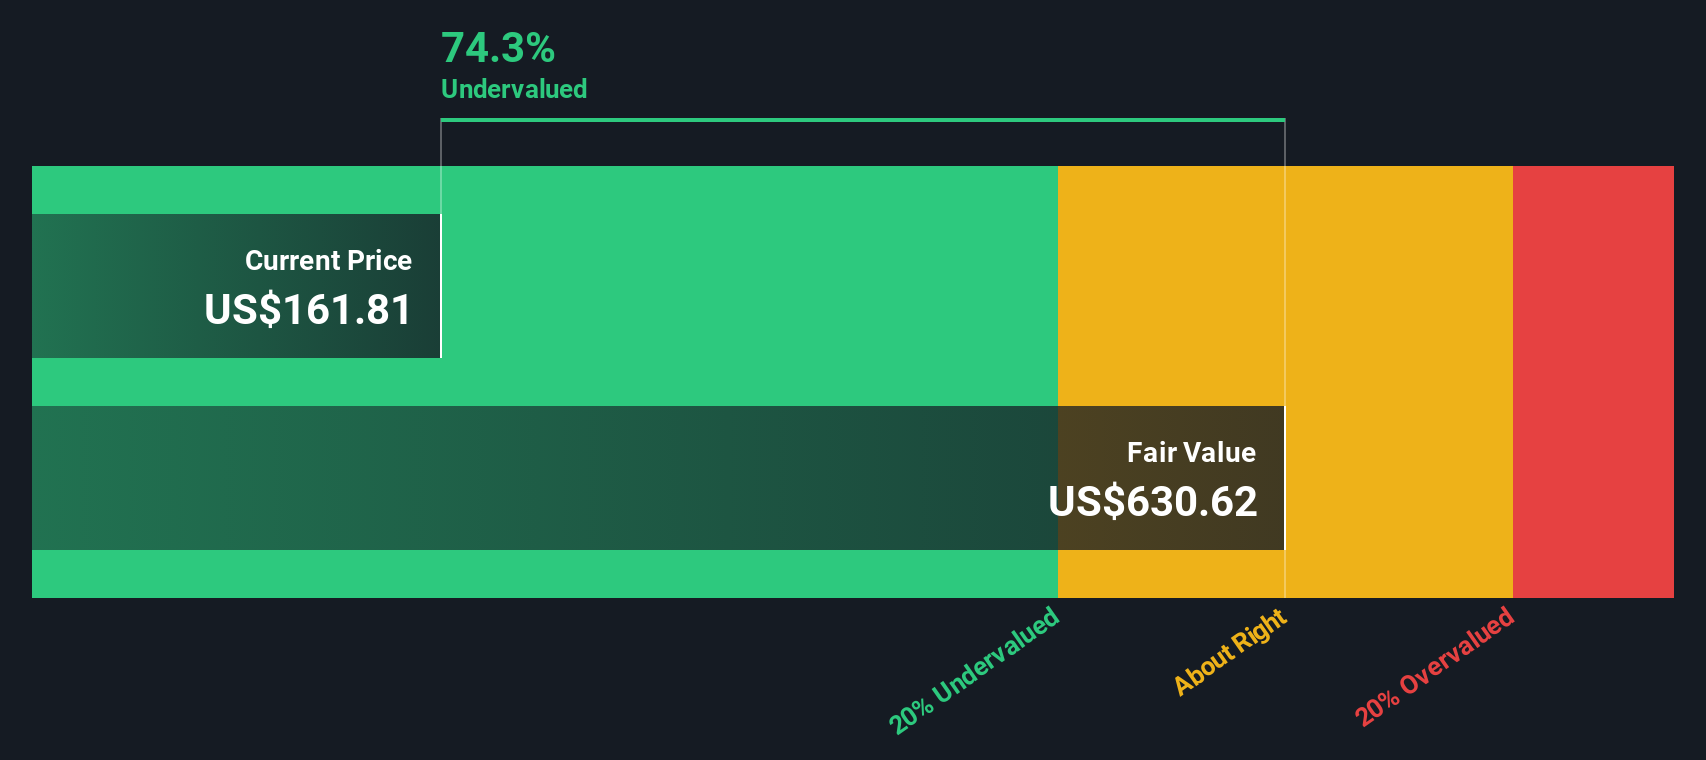
When all of those projected cash flows are discounted back to today under the DCF model, the estimated intrinsic value comes out at about $383.75 per share. Compared with Insmed’s recent share price of US$175.07, this estimate suggests the stock is trading at a 54.4% discount to that DCF value, based on this specific model and its assumptions.
Result: UNDERVALUED (DCF model estimate)
Our Discounted Cash Flow (DCF) analysis suggests Insmed is undervalued by 54.4%. Track this in your watchlist or portfolio, or discover 876 more undervalued stocks based on cash flows.
Approach 2: Insmed Price vs Book
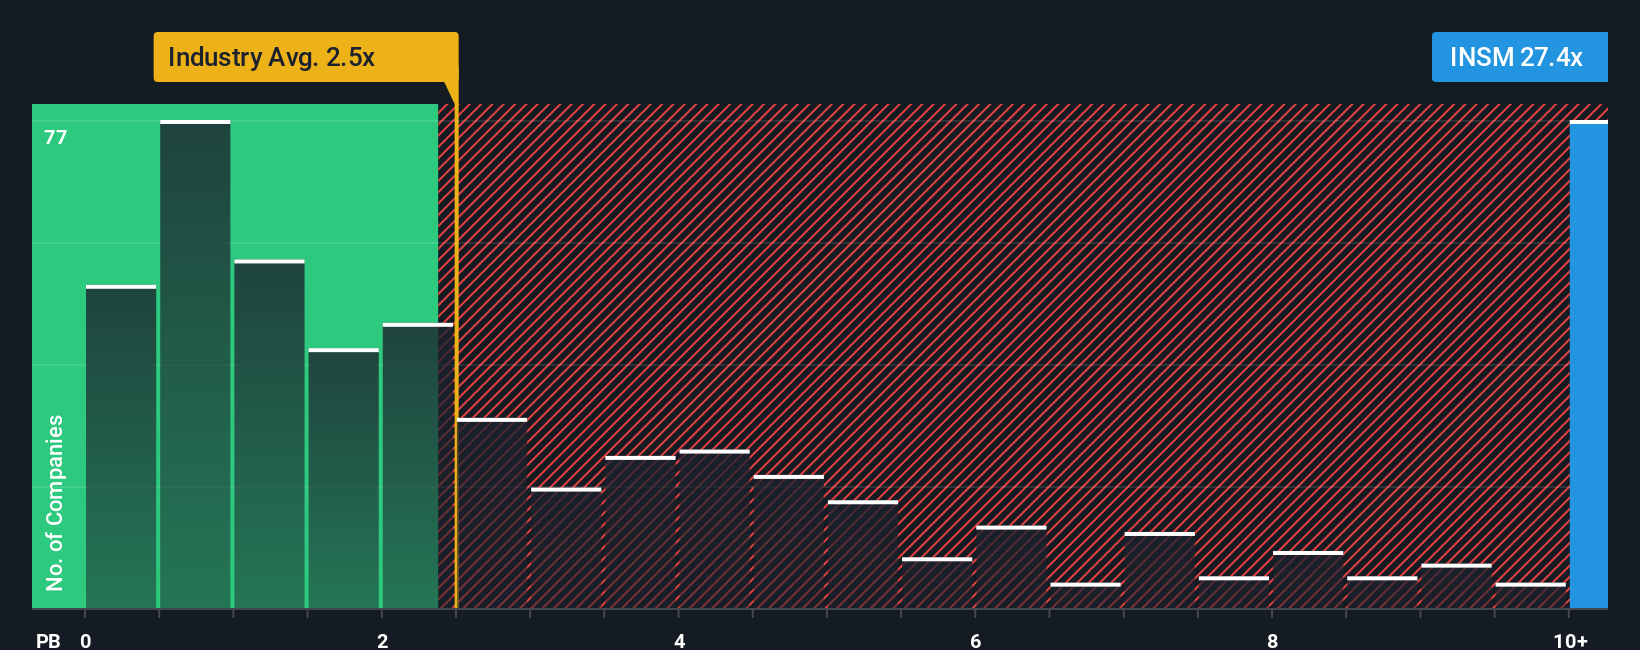
For companies where investors focus on the value of underlying assets and balance sheet strength, the P/B ratio is often a useful cross check on valuation. It compares what the market is paying for each dollar of accounting net assets, which can be especially relevant for asset heavy or early commercial stage healthcare businesses.
Growth expectations and perceived risk both influence what looks like a normal P/B multiple. Higher growth or a stronger competitive position can support a higher P/B, while higher uncertainty or weaker profitability can point to a lower one.
Insmed currently trades on a P/B of 39.49x, compared with the Biotechs industry average of 2.67x and a peer group average of 67.22x. Simply Wall St also applies its proprietary Fair Ratio framework, which estimates the P/B you might expect based on factors such as earnings growth, industry, profit margin, market cap and specific risks.
This Fair Ratio approach can be more tailored than a simple comparison to peers or the industry, because it tries to adjust for differences in business quality and risk profile rather than assuming all companies should trade on the same multiple. As the Fair Ratio figure is not available here, it is not possible to classify Insmed as overvalued or undervalued using this method.
Result: ABOUT RIGHT
P/B ratios tell one story, but what if the real opportunity lies elsewhere? Discover 1447 companies where insiders are betting big on explosive growth.
Upgrade Your Decision Making: Choose your Insmed Narrative
Earlier we mentioned that there is an even better way to think about valuation, and on Simply Wall St this takes the form of Narratives. With Narratives, you set out your story for Insmed, link that story to your own revenue, earnings and margin estimates, and see how those assumptions roll into a fair value on the Community page used by millions of investors. You can then compare that fair value with the current price to help you decide whether the stock looks like a buy, a hold, or a sell for you. The whole view updates automatically when new earnings, news or analyst targets come in. For example, one investor might build a more optimistic Insmed Narrative around catalysts such as European bronchiectasis approval, high revenue growth assumptions and a higher fair value closer to the upper analyst target of US$215.56. Another investor could frame a more cautious Narrative that leans on risks around regulatory timing, payer access and earnings uncertainty, and therefore sits nearer the lower end of recent analyst targets at US$89.00.
Do you think there's more to the story for Insmed? Head over to our Community to see what others are saying!
This article by Simply Wall St is general in nature. We provide commentary based on historical data and analyst forecasts only using an unbiased methodology and our articles are not intended to be financial advice. It does not constitute a recommendation to buy or sell any stock, and does not take account of your objectives, or your financial situation. We aim to bring you long-term focused analysis driven by fundamental data. Note that our analysis may not factor in the latest price-sensitive company announcements or qualitative material. Simply Wall St has no position in any stocks mentioned.
Have feedback on this article? Concerned about the content? Get in touch with us directly. Alternatively, email editorial-team@simplywallst.com