
- LIVE QUOTES
- LEARN
- HELP
 Nasdaq
 Wall Street Journal
EN
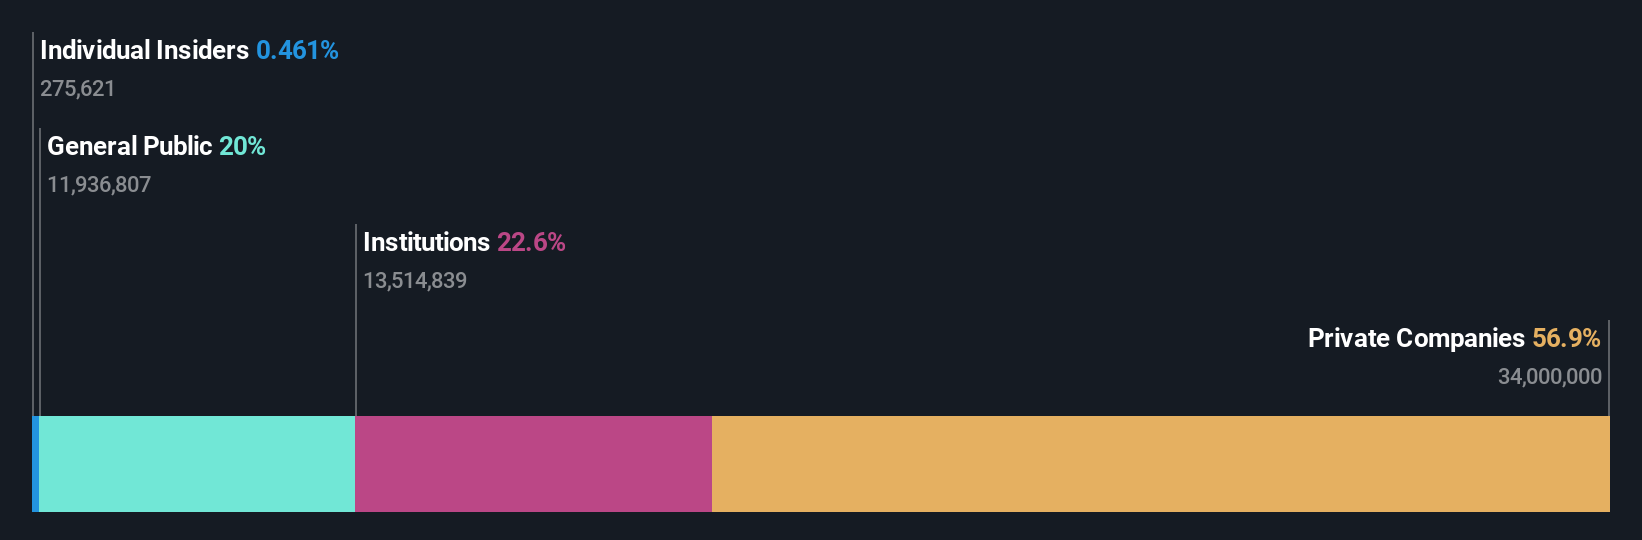
Winpak Ltd.'s (TSE:WPK) largest shareholders are private companies with 57% ownership, institutions own 23%
Key Insights
- Significant control over Winpak by private companies implies that the general public has more power to influence management and governance-related decisions
- 57% of the company is held by a single shareholder (Wihuri International Oy)
- Insiders have sold recently
Every investor in Winpak Ltd. (TSE:WPK) should be aware of the most powerful shareholder groups. The group holding the most number of shares in the company, around 57% to be precise, is private companies. In other words, the group stands to gain the most (or lose the most) from their investment into the company.
Meanwhile, institutions make up 23% of the company’s shareholders. Large companies usually have institutions as shareholders, and we usually see insiders owning shares in smaller companies.
Let's take a closer look to see what the different types of shareholders can tell us about Winpak.
Check out our latest analysis for Winpak
What Does The Institutional Ownership Tell Us About Winpak?
Many institutions measure their performance against an index that approximates the local market. So they usually pay more attention to companies that are included in major indices.
As you can see, institutional investors have a fair amount of stake in Winpak. This suggests some credibility amongst professional investors. But we can't rely on that fact alone since institutions make bad investments sometimes, just like everyone does. It is not uncommon to see a big share price drop if two large institutional investors try to sell out of a stock at the same time. So it is worth checking the past earnings trajectory of Winpak, (below). Of course, keep in mind that there are other factors to consider, too.

We note that hedge funds don't have a meaningful investment in Winpak. Wihuri International Oy is currently the largest shareholder, with 57% of shares outstanding. This essentially means that they have extensive influence, if not outright control, over the future of the corporation. Tweedy, Browne Company LLC is the second largest shareholder owning 4.0% of common stock, and The Vanguard Group, Inc. holds about 1.7% of the company stock.
While it makes sense to study institutional ownership data for a company, it also makes sense to study analyst sentiments to know which way the wind is blowing. There are a reasonable number of analysts covering the stock, so it might be useful to find out their aggregate view on the future.
Insider Ownership Of Winpak
The definition of company insiders can be subjective and does vary between jurisdictions. Our data reflects individual insiders, capturing board members at the very least. Company management run the business, but the CEO will answer to the board, even if he or she is a member of it.
Most consider insider ownership a positive because it can indicate the board is well aligned with other shareholders. However, on some occasions too much power is concentrated within this group.
Our most recent data indicates that insiders own less than 1% of Winpak Ltd.. But they may have an indirect interest through a corporate structure that we haven't picked up on. It's a big company, so even a small proportional interest can create alignment between the board and shareholders. In this case insiders own CA$12m worth of shares. It is good to see board members owning shares, but it might be worth checking if those insiders have been buying.
General Public Ownership
The general public-- including retail investors -- own 20% stake in the company, and hence can't easily be ignored. This size of ownership, while considerable, may not be enough to change company policy if the decision is not in sync with other large shareholders.
Private Company Ownership
We can see that Private Companies own 57%, of the shares on issue. It's hard to draw any conclusions from this fact alone, so its worth looking into who owns those private companies. Sometimes insiders or other related parties have an interest in shares in a public company through a separate private company.
Next Steps:
I find it very interesting to look at who exactly owns a company. But to truly gain insight, we need to consider other information, too.
Many find it useful to take an in depth look at how a company has performed in the past. You can access this detailed graph of past earnings, revenue and cash flow.
If you are like me, you may want to think about whether this company will grow or shrink. Luckily, you can check this free report showing analyst forecasts for its future.
NB: Figures in this article are calculated using data from the last twelve months, which refer to the 12-month period ending on the last date of the month the financial statement is dated. This may not be consistent with full year annual report figures.
Have feedback on this article? Concerned about the content? Get in touch with us directly. Alternatively, email editorial-team (at) simplywallst.com.
This article by Simply Wall St is general in nature. We provide commentary based on historical data and analyst forecasts only using an unbiased methodology and our articles are not intended to be financial advice. It does not constitute a recommendation to buy or sell any stock, and does not take account of your objectives, or your financial situation. We aim to bring you long-term focused analysis driven by fundamental data. Note that our analysis may not factor in the latest price-sensitive company announcements or qualitative material. Simply Wall St has no position in any stocks mentioned.