
- LIVE QUOTES
- LEARN
- HELP
 Nasdaq
 Wall Street Journal
EN
Is Plug Power (PLUG) Pricing Reflect Recent Hydrogen Ambitions Or Market Skepticism
- If you are wondering whether Plug Power's current share price makes sense, you are not alone. Many investors are trying to work out what the stock is really worth today.
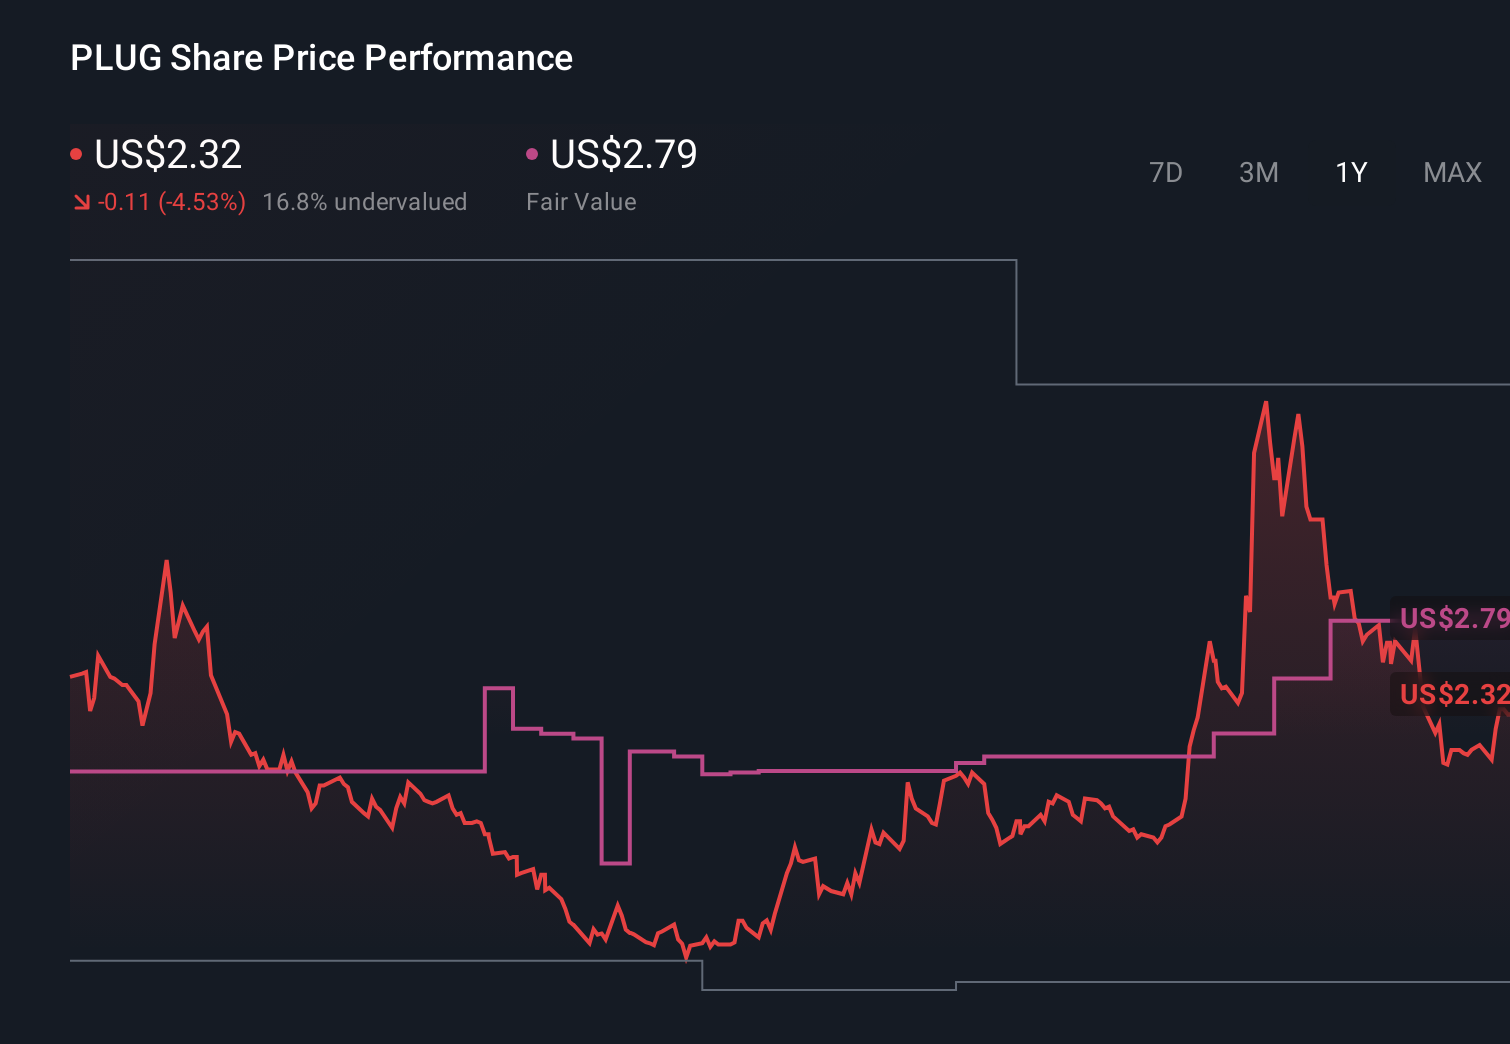
- The stock has recently shown mixed momentum, with a 21.3% return over the last 7 days and 10.6% over 30 days, while the year to date return sits at 7.2% and the 1 year return at a 10.5% decline, alongside much larger falls of 85.3% over 3 years and 96.6% over 5 years.
- Recent attention on Plug Power has mainly centered on its position in the hydrogen and fuel cell space and how its capital needs, project execution and funding plans fit into that story. These developments have framed how the market is reassessing both the potential and the risks around the stock's future business model.
- Our Simply Wall St valuation checks currently give Plug Power a 2 out of 6 valuation score. This raises fair questions about what different valuation methods are actually saying, and later in the article we will also look at a more complete way to think about value beyond any single model.
Plug Power scores just 2/6 on our valuation checks. See what other red flags we found in the full valuation breakdown.
Approach 1: Plug Power Discounted Cash Flow (DCF) Analysis
A Discounted Cash Flow (DCF) model estimates what a company could be worth by projecting its future cash flows and then discounting those back to today in dollar terms. For Plug Power, the model used is a 2 Stage Free Cash Flow to Equity approach.
The latest twelve month free cash flow is a loss of about $904.4 million. Analyst and extrapolated projections used in the model move from an estimated free cash flow loss of $368.2 million in 2026 to a positive $466.7 million by 2030, then continue higher in the later extrapolated years. All figures here are in millions of dollars.
Bringing these projected cash flows back to today produces an estimated intrinsic value of $6.98 per share. Compared with the current market price, the model implies a 65.8% discount, which indicates that Plug Power is trading well below this DCF estimate.
Result: UNDERVALUED
Our Discounted Cash Flow (DCF) analysis suggests Plug Power is undervalued by 65.8%. Track this in your watchlist or portfolio, or discover 875 more undervalued stocks based on cash flows.
Approach 2: Plug Power Price vs Sales
For companies where earnings are not yet positive or are quite volatile, the P/S ratio is often a more practical gauge than P/E because it compares the share price to revenue rather than profit. Investors still care about growth and risk though, since higher growth and lower perceived risk can justify a higher P/S multiple, while slower growth or higher uncertainty usually line up with a lower, more cautious range.
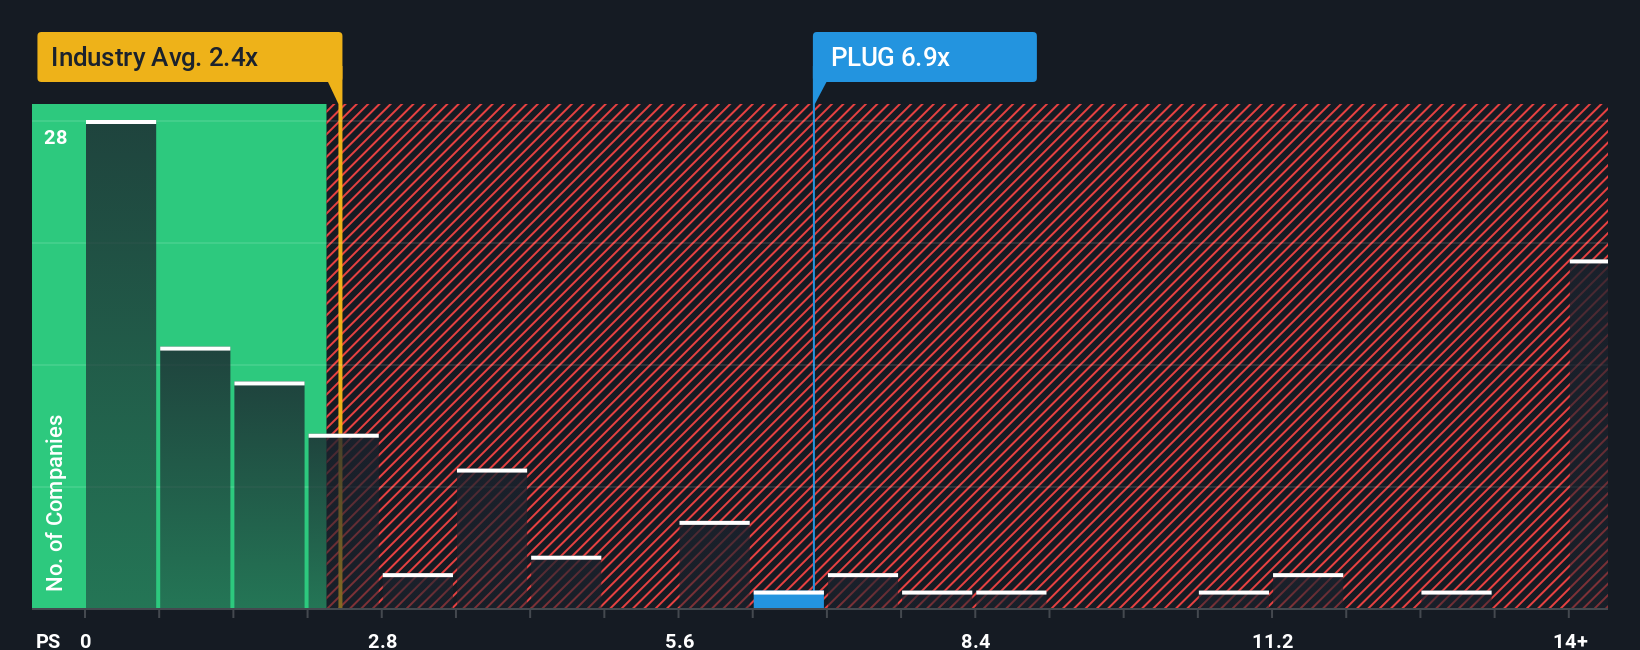
Plug Power currently trades on a P/S ratio of 4.85x. That sits above the Electrical industry average of 2.14x and also above the peer average of 4.53x, so on simple comparisons the stock carries a higher revenue multiple than these benchmarks.
Simply Wall St's Fair Ratio for Plug Power is 0.20x on a P/S basis. This is a proprietary estimate of what P/S might make sense after weighing factors such as the company’s earnings profile, industry, profit margins, market capitalization and key risks. Because it is tailored to the company’s own characteristics, it can be more informative than relying only on broad industry or peer averages. Comparing the Fair Ratio of 0.20x with the current 4.85x suggests the shares are pricing in more optimism than this framework supports.
Result: OVERVALUED
P/S ratios tell one story, but what if the real opportunity lies elsewhere? Discover 1447 companies where insiders are betting big on explosive growth.
Upgrade Your Decision Making: Choose your Plug Power Narrative
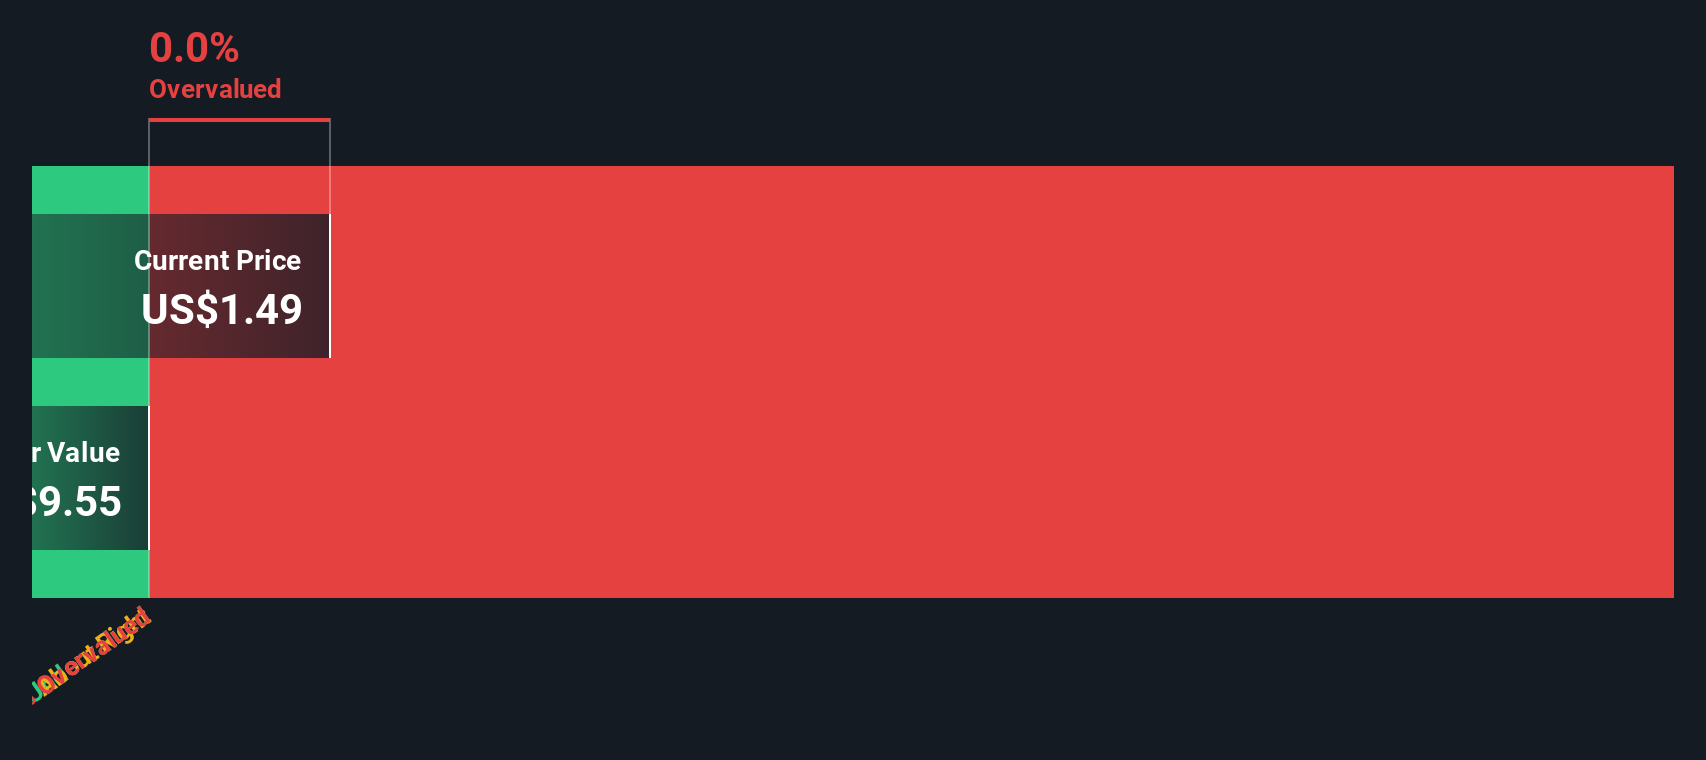
Earlier we mentioned that there is an even better way to think about valuation. On Simply Wall St you can use Narratives, where you set out your story for Plug Power, translate that into expectations for future revenue, earnings and margins, and see a fair value that updates automatically as new news or earnings arrive. You can then compare that fair value with the current price to decide whether the stock looks attractive to you. This means one investor might build a more optimistic Plug Power Narrative closer to the higher US$5.00 analyst target, while another might align with the more cautious US$0.55 view. All of this is available within an easy tool on the Community page that lets you see and refine different perspectives side by side.
Do you think there's more to the story for Plug Power? Head over to our Community to see what others are saying!
This article by Simply Wall St is general in nature. We provide commentary based on historical data and analyst forecasts only using an unbiased methodology and our articles are not intended to be financial advice. It does not constitute a recommendation to buy or sell any stock, and does not take account of your objectives, or your financial situation. We aim to bring you long-term focused analysis driven by fundamental data. Note that our analysis may not factor in the latest price-sensitive company announcements or qualitative material. Simply Wall St has no position in any stocks mentioned.
Have feedback on this article? Concerned about the content? Get in touch with us directly. Alternatively, email editorial-team@simplywallst.com