
- LIVE QUOTES
- LEARN
- HELP
 Nasdaq
 Wall Street Journal
EN
Is It Too Late To Consider Symbotic (SYM) After A 175% One Year Share Price Surge?
- Wondering whether Symbotic's current share price actually lines up with its business prospects, or if expectations have just run ahead of reality?
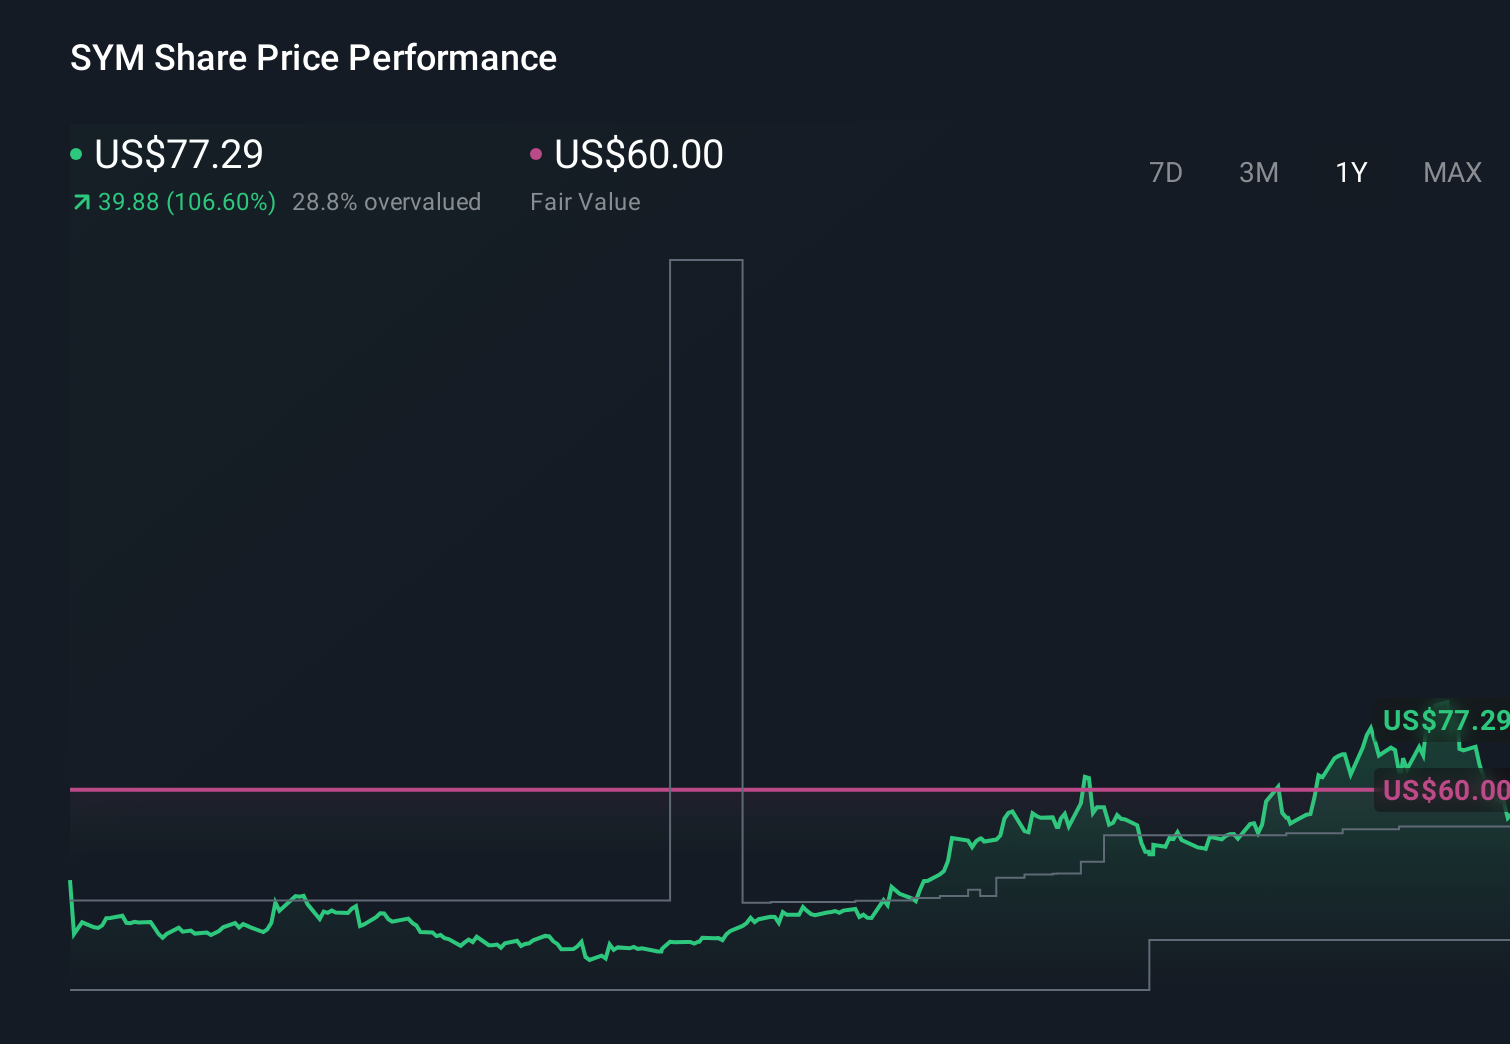
- Symbotic's stock recently closed at US$70.45, with returns of 16.9% over 7 days, 18.0% over 30 days, 8.6% year to date and 175.3% over the last year, which naturally raises questions about how much future success is already priced in.
- Recent headlines have focused on Symbotic's role in warehouse automation and ongoing interest from major retail and logistics partners, which helps explain why the stock has drawn so much attention. Coverage has often framed the company as a key player in automating complex supply chains, giving context to the strong share price performance.
- Even with that backdrop, Symbotic only scores 1 out of 6 on our valuation checks for undervaluation. In the sections that follow, we will walk through what different methods say about the current price and then finish with a more rounded way to think about what the stock might be worth.
Symbotic scores just 1/6 on our valuation checks. See what other red flags we found in the full valuation breakdown.
Approach 1: Symbotic Discounted Cash Flow (DCF) Analysis
A Discounted Cash Flow, or DCF, model takes projected future cash flows and discounts them back to what they might be worth today. It is essentially asking what a stream of future cash in your pocket could be worth in present dollars.
For Symbotic, the model used is a 2 Stage Free Cash Flow to Equity approach based on cash flow projections. The company’s latest twelve month free cash flow is about $804.5 million. Analysts have provided estimates out to 2029, and Simply Wall St extrapolates further, with projected free cash flow of $1.76b in 2030 and continuing projections up to 2035, all expressed in $. These future amounts are discounted back to today to arrive at an estimated intrinsic value per share.
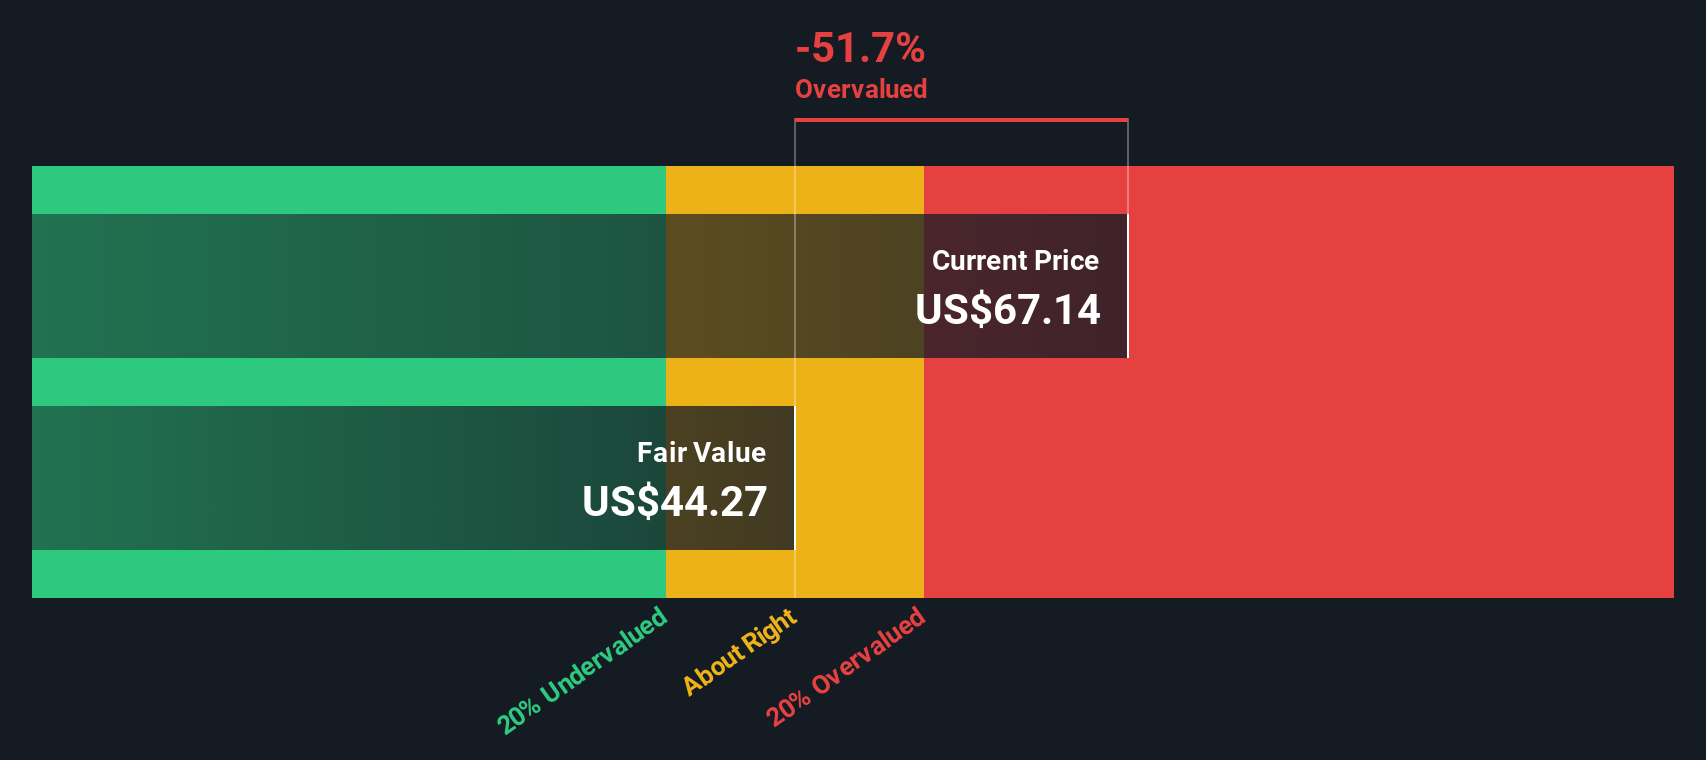
That DCF calculation suggests a fair value of about $45.66 per share, compared with the recent share price of US$70.45. On this model, the stock screens as about 54.3% overvalued.
Result: OVERVALUED
Our Discounted Cash Flow (DCF) analysis suggests Symbotic may be overvalued by 54.3%. Discover 875 undervalued stocks or create your own screener to find better value opportunities.
Approach 2: Symbotic Price vs Sales
For companies where earnings are not the clearest guide, the P/S ratio is often a useful cross check because it compares the share price to the revenue the business is already generating. Investors typically look for a higher P/S when they expect stronger growth, and a lower P/S when they see more uncertainty or risk.
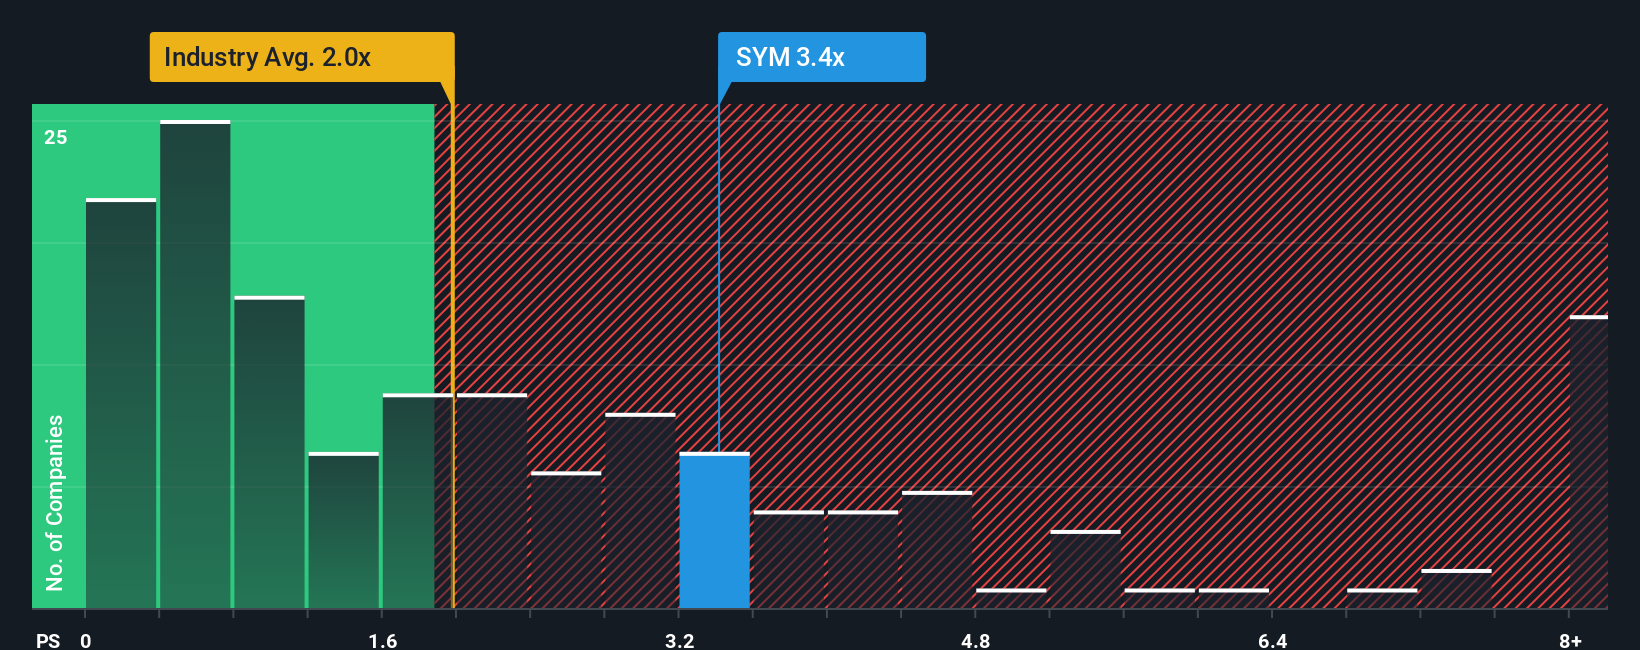
Symbotic currently trades on a P/S of 3.82x. That sits above the Machinery industry average of 2.06x and also above the peer group average of 3.56x, which suggests the market is already assigning a premium compared with many similar businesses.
Simply Wall St’s Fair Ratio metric goes a step further by estimating what P/S multiple might be reasonable given Symbotic’s own profile, including its growth outlook, profit margin, industry, market cap and risk factors. For Symbotic, this Fair Ratio comes out at 5.12x, which is higher than the current 3.82x P/S. On this framework, the stock screens as undervalued on a sales multiple basis.
Result: UNDERVALUED
P/S ratios tell one story, but what if the real opportunity lies elsewhere? Discover 1447 companies where insiders are betting big on explosive growth.
Upgrade Your Decision Making: Choose your Symbotic Narrative
Earlier we mentioned that there is an even better way to understand valuation, so let us introduce you to Narratives, a simple tool on Simply Wall St’s Community page that lets you write the story you believe about Symbotic, link that story to your own forecast for revenue, earnings and margins, turn those forecasts into a fair value, and then compare that fair value to the current share price. The whole view updates as new earnings or news arrive, so you can see, for example, how one Symbotic Narrative built around the higher analyst fair value of about US$61.71 per share contrasts with a far more cautious Narrative closer to the bearish US$10 target, and decide which story feels more realistic to you.
Do you think there's more to the story for Symbotic? Head over to our Community to see what others are saying!
This article by Simply Wall St is general in nature. We provide commentary based on historical data and analyst forecasts only using an unbiased methodology and our articles are not intended to be financial advice. It does not constitute a recommendation to buy or sell any stock, and does not take account of your objectives, or your financial situation. We aim to bring you long-term focused analysis driven by fundamental data. Note that our analysis may not factor in the latest price-sensitive company announcements or qualitative material. Simply Wall St has no position in any stocks mentioned.
Have feedback on this article? Concerned about the content? Get in touch with us directly. Alternatively, email editorial-team@simplywallst.com