
- LIVE QUOTES
- LEARN
- HELP
 Nasdaq
 Wall Street Journal
EN
Bure Equity AB (publ)'s (STO:BURE) latest 3.2% decline adds to one-year losses, institutional investors may consider drastic measures
Key Insights
- Significantly high institutional ownership implies Bure Equity's stock price is sensitive to their trading actions
- 54% of the business is held by the top 8 shareholders
- Insiders own 24% of Bure Equity
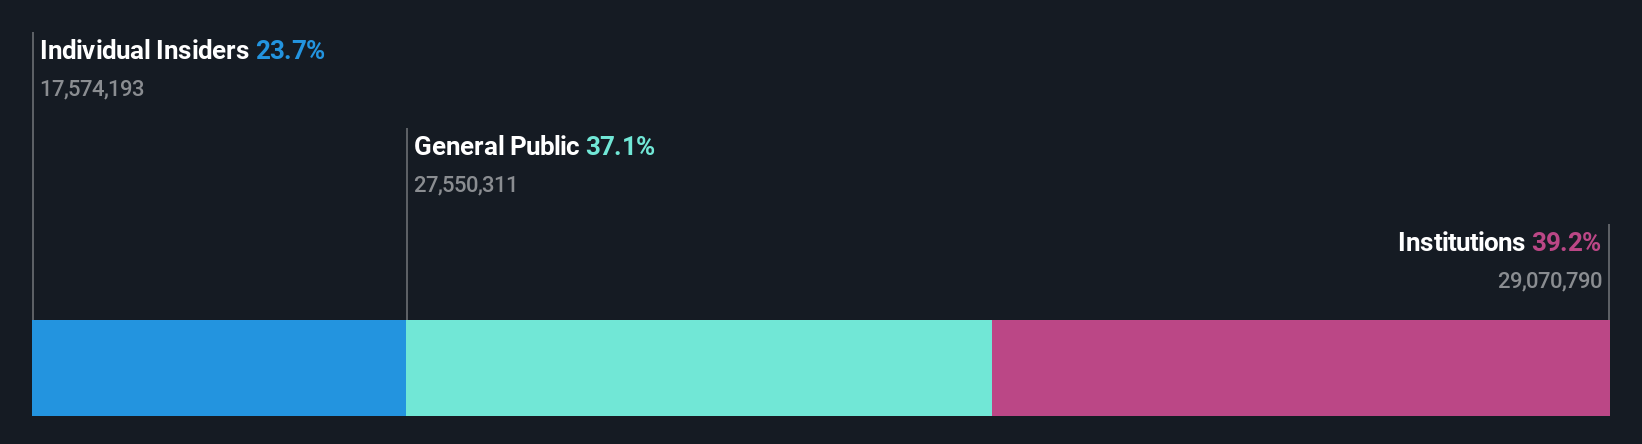
To get a sense of who is truly in control of Bure Equity AB (publ) (STO:BURE), it is important to understand the ownership structure of the business. We can see that institutions own the lion's share in the company with 39% ownership. That is, the group stands to benefit the most if the stock rises (or lose the most if there is a downturn).
And institutional investors endured the highest losses after the company's share price fell by 3.2% last week. This set of investors may especially be concerned about the current loss, which adds to a one-year loss of 39% for shareholders. Also referred to as "smart money", institutions have a lot of sway over how a stock's price moves. As a result, if the downtrend continues, institutions may face pressures to sell Bure Equity, which might have negative implications on individual investors.
In the chart below, we zoom in on the different ownership groups of Bure Equity.
See our latest analysis for Bure Equity
What Does The Institutional Ownership Tell Us About Bure Equity?
Institutions typically measure themselves against a benchmark when reporting to their own investors, so they often become more enthusiastic about a stock once it's included in a major index. We would expect most companies to have some institutions on the register, especially if they are growing.
As you can see, institutional investors have a fair amount of stake in Bure Equity. This implies the analysts working for those institutions have looked at the stock and they like it. But just like anyone else, they could be wrong. If multiple institutions change their view on a stock at the same time, you could see the share price drop fast. It's therefore worth looking at Bure Equity's earnings history below. Of course, the future is what really matters.

Hedge funds don't have many shares in Bure Equity. Our data shows that Johan Tigerschiold is the largest shareholder with 10% of shares outstanding. Familjen Björkman Incl. Foundations is the second largest shareholder owning 8.2% of common stock, and Fourth Swedish National Pension Fund (AP4) holds about 7.6% of the company stock.
We did some more digging and found that 8 of the top shareholders account for roughly 54% of the register, implying that along with larger shareholders, there are a few smaller shareholders, thereby balancing out each others interests somewhat.
Researching institutional ownership is a good way to gauge and filter a stock's expected performance. The same can be achieved by studying analyst sentiments. Our information suggests that there isn't any analyst coverage of the stock, so it is probably little known.
Insider Ownership Of Bure Equity
The definition of company insiders can be subjective and does vary between jurisdictions. Our data reflects individual insiders, capturing board members at the very least. Management ultimately answers to the board. However, it is not uncommon for managers to be executive board members, especially if they are a founder or the CEO.
I generally consider insider ownership to be a good thing. However, on some occasions it makes it more difficult for other shareholders to hold the board accountable for decisions.
Our information suggests that insiders maintain a significant holding in Bure Equity AB (publ). Insiders own kr4.2b worth of shares in the kr18b company. That's quite meaningful. Most would say this shows a good degree of alignment with shareholders, especially in a company of this size. You can click here to see if those insiders have been buying or selling.
General Public Ownership
With a 37% ownership, the general public, mostly comprising of individual investors, have some degree of sway over Bure Equity. While this size of ownership may not be enough to sway a policy decision in their favour, they can still make a collective impact on company policies.
Next Steps:
It's always worth thinking about the different groups who own shares in a company. But to understand Bure Equity better, we need to consider many other factors. Consider risks, for instance. Every company has them, and we've spotted 2 warning signs for Bure Equity you should know about.
Of course, you might find a fantastic investment by looking elsewhere. So take a peek at this free list of interesting companies.
NB: Figures in this article are calculated using data from the last twelve months, which refer to the 12-month period ending on the last date of the month the financial statement is dated. This may not be consistent with full year annual report figures.
Have feedback on this article? Concerned about the content? Get in touch with us directly. Alternatively, email editorial-team (at) simplywallst.com.
This article by Simply Wall St is general in nature. We provide commentary based on historical data and analyst forecasts only using an unbiased methodology and our articles are not intended to be financial advice. It does not constitute a recommendation to buy or sell any stock, and does not take account of your objectives, or your financial situation. We aim to bring you long-term focused analysis driven by fundamental data. Note that our analysis may not factor in the latest price-sensitive company announcements or qualitative material. Simply Wall St has no position in any stocks mentioned.