
- LIVE QUOTES
- LEARN
- HELP
 Nasdaq
 Wall Street Journal
EN
Winnebago Industries (WGO) Valuation Check After Recent Share Price Momentum And Mixed Return Profile
With no single headline event steering recent trading, Winnebago Industries (WGO) has still drawn attention as investors weigh its recreational vehicle and marine exposure against mixed return figures and modest revenue and net income growth.
See our latest analysis for Winnebago Industries.
Recent trading has been brisk, with a 32.93% 90 day share price return and a 12.37% 30 day share price return pushing Winnebago to US$42.71, even as the 1 year total shareholder return sits at a 6.65% decline. This suggests momentum has picked up in the short term while longer term holders have had a tougher run.
If Winnebago's recent rebound has you thinking about what else is moving, this could be a good moment to scan auto manufacturers for other ideas in the auto space.
So with Winnebago trading at US$42.71, mixed long term returns, modest revenue and net income growth, and a discount to the average analyst target, is there still a genuine buying opportunity here, or is the market already pricing in future growth?
Most Popular Narrative Narrative: 11.8% Undervalued
Winnebago Industries' most followed narrative pegs fair value at about US$48.42 per share versus the last close of US$42.71, framing the recent rebound against a higher long term earnings view.
The successful launch and ramp up of the Grand Design Motorhome Lineage lineup, including new models like the Series M Class C, Series F Super C Coach, and Series VT Class B, is expected to boost future revenues and market share in the motorized RV segment. The strategic transformation of Winnebago Towables under new leadership, with a focus on innovative pricing and product strategies, aims to increase market share and drive revenue growth in the competitive towables market.
Curious what justifies a higher value than today's price? The narrative leans on faster earnings growth, fatter margins, and a future earnings multiple that still sits below many auto peers. If you want to see exactly how those moving parts stack up across revenue, margins, and share count over the next few years, the full narrative breaks down the equations behind that fair value line by line.
Result: Fair Value of $48.42 (UNDERVALUED)
Have a read of the narrative in full and understand what's behind the forecasts.
However, softer retail RV demand and pressure on premium buyers, along with lean dealer inventories, could easily challenge those higher earnings and fair value assumptions.
Find out about the key risks to this Winnebago Industries narrative.
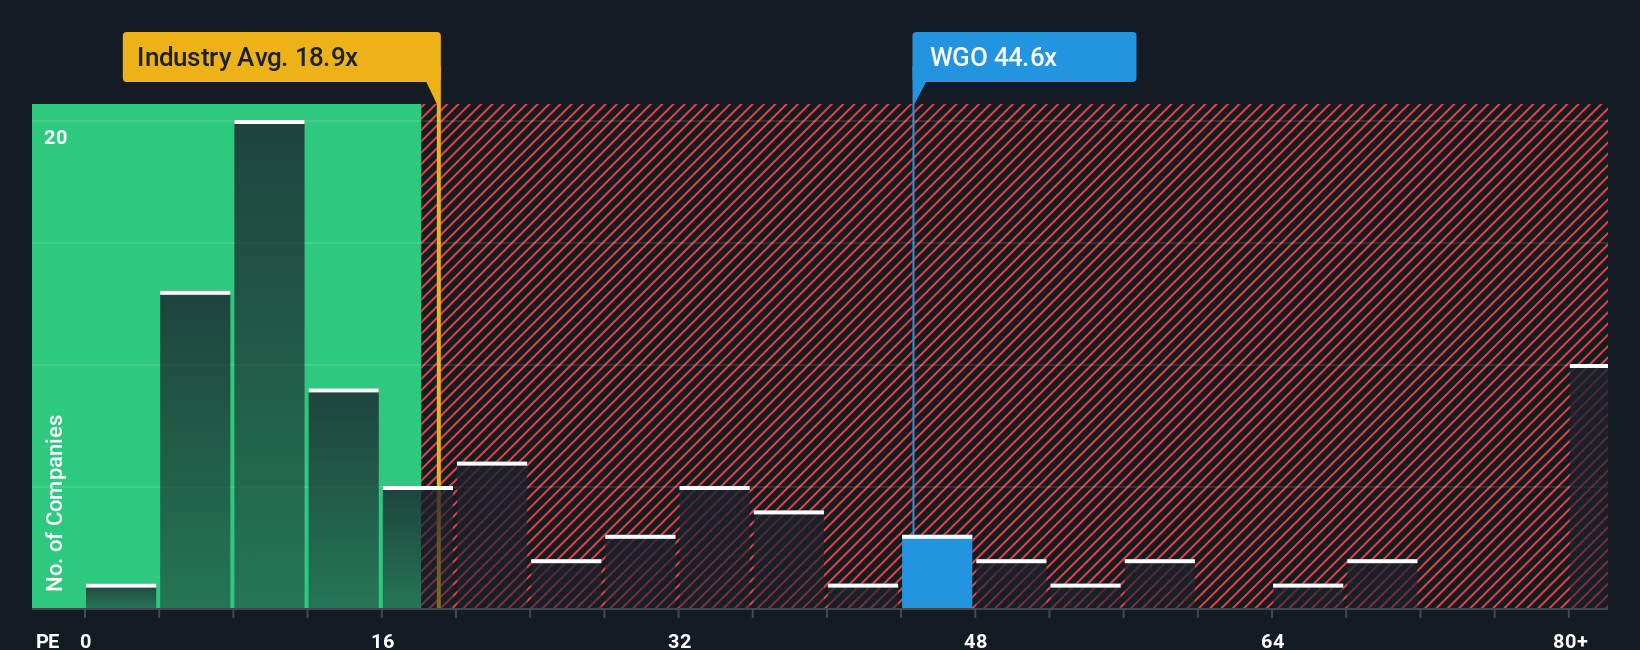
Another View: Current P/E Points To Expensive Territory
That 11.8% gap to the narrative fair value sits uneasily next to how the market is pricing Winnebago today. The shares trade on a P/E of 33.1x, compared with a peer average of 15.7x and a fair ratio of 24x that our work suggests the market could trend toward.
Put simply, the current P/E implies you are paying far more for each dollar of earnings than both peers and that fair ratio indicate. If sentiment cools or earnings do not build as expected, that gap could close the hard way via the share price rather than the earnings line. Which outcome do you think is more realistic?
See what the numbers say about this price — find out in our valuation breakdown.
Build Your Own Winnebago Industries Narrative
If you see the numbers differently or simply prefer to test your own assumptions against the data, you can build a custom view in minutes with Do it your way.
A great starting point for your Winnebago Industries research is our analysis highlighting 2 key rewards and 1 important warning sign that could impact your investment decision.
Looking for more investment ideas?
If you are serious about building a sharper watchlist, do not stop with one stock when you can quickly scan focused groups of opportunities instead.
- Spot potential value plays early by running your filters across these 877 undervalued stocks based on cash flows that the market may be pricing conservatively.
- Tap into cutting edge themes with these 25 AI penny stocks that connect artificial intelligence with real business models and financials.
- Target income-focused opportunities through these 11 dividend stocks with yields > 3% offering yields above 3% for investors who care about regular cash returns.
This article by Simply Wall St is general in nature. We provide commentary based on historical data and analyst forecasts only using an unbiased methodology and our articles are not intended to be financial advice. It does not constitute a recommendation to buy or sell any stock, and does not take account of your objectives, or your financial situation. We aim to bring you long-term focused analysis driven by fundamental data. Note that our analysis may not factor in the latest price-sensitive company announcements or qualitative material. Simply Wall St has no position in any stocks mentioned.
Have feedback on this article? Concerned about the content? Get in touch with us directly. Alternatively, email editorial-team@simplywallst.com