
- LIVE QUOTES
- LEARN
- HELP
 Nasdaq
 Wall Street Journal
EN
Reassessing Paccar (PCAR) Valuation After Strong Recent Share Price Momentum
PACCAR (PCAR) has drawn fresh attention after recent share price moves, prompting investors to revisit how its truck manufacturing, parts distribution, and financial services operations align with the current valuation and recent return profile.
See our latest analysis for PACCAR.
The current US$117.08 share price comes after a 3.68% 1 day share price return and a 22.30% 90 day share price return, while the 5 year total shareholder return of 136.46% points to momentum that has built over a longer horizon.
If PACCAR has you looking closer at transport and industrial names, it could be a good moment to broaden your search with auto manufacturers.
With PACCAR trading at US$117.08, sitting above the average analyst price target yet showing an intrinsic value estimate at a discount, you have to ask yourself whether there is still a buying opportunity here or whether the market is already pricing in future growth.
Most Popular Narrative Narrative: 9.1% Overvalued
With PACCAR closing at US$117.08 against a narrative fair value of US$107.28, the gap comes down to how future earnings and margins are framed.
The analysts have a consensus price target of $103.5 for PACCAR based on their expectations of its future earnings growth, profit margins and other risk factors. However, there is a degree of disagreement amongst analysts, with the most bullish reporting a price target of $131.0, and the most bearish reporting a price target of just $86.0.
Want the full story on why this fair value sits where it does? Revenue pacing, margin shifts and the chosen earnings multiple all play crucial roles.
Result: Fair Value of $107.28 (OVERVALUED)
Have a read of the narrative in full and understand what's behind the forecasts.
However, the story can change quickly if tariffs raise input costs faster than PACCAR can offset them, or if soft truck orders drag on longer than expected.
Find out about the key risks to this PACCAR narrative.
Another View: Earnings Multiple Sends A Different Signal
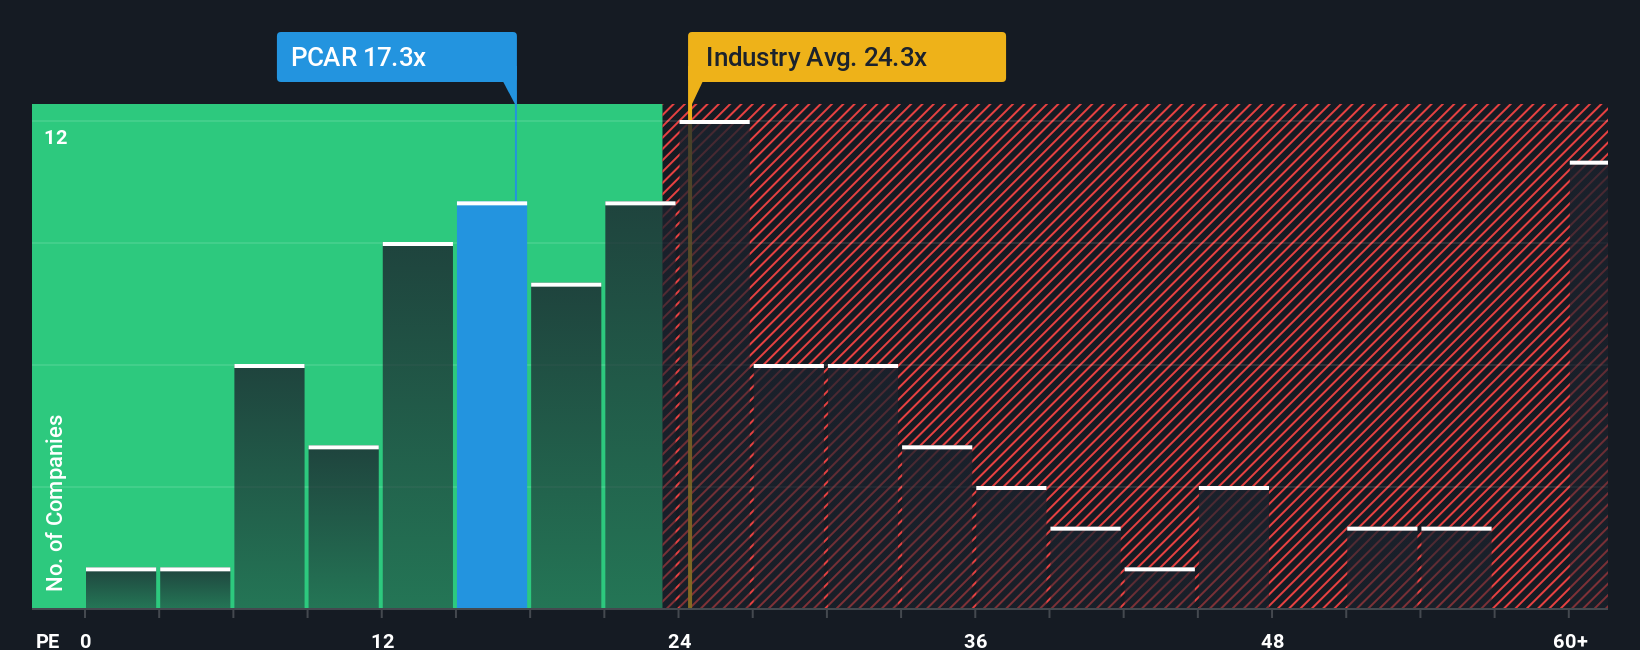
While the narrative fair value points to PACCAR being 9.1% overvalued, its 22.9x P/E tells a different story. That level sits below both the US Machinery industry at 25.4x and the peer average at 26x, and below a 32.8x fair ratio that our modelling suggests the market could move towards. In plain terms, the current price builds in less optimism than those comparison points might imply. This raises the question: is sentiment being too cautious, or is the narrative model capturing something that the multiples are not?
See what the numbers say about this price — find out in our valuation breakdown.
Build Your Own PACCAR Narrative
If you see the numbers differently or prefer to test your own assumptions, you can build a custom PACCAR view in just a few minutes by starting with Do it your way.
A great starting point for your PACCAR research is our analysis highlighting 3 key rewards and 2 important warning signs that could impact your investment decision.
Ready For More Stock Ideas?
If PACCAR has sharpened your thinking, do not stop here. Use targeted screeners to spot other ideas that could fit your portfolio before others catch on.
- Hunt for potential value with these 877 undervalued stocks based on cash flows that line up current prices against cash flow based metrics.
- Zero in on income ideas using these 11 dividend stocks with yields > 3% that focus on companies offering dividend yields above 3%.
- Tap into growth themes around artificial intelligence by scanning these 25 AI penny stocks that concentrate on this sector.
This article by Simply Wall St is general in nature. We provide commentary based on historical data and analyst forecasts only using an unbiased methodology and our articles are not intended to be financial advice. It does not constitute a recommendation to buy or sell any stock, and does not take account of your objectives, or your financial situation. We aim to bring you long-term focused analysis driven by fundamental data. Note that our analysis may not factor in the latest price-sensitive company announcements or qualitative material. Simply Wall St has no position in any stocks mentioned.
Have feedback on this article? Concerned about the content? Get in touch with us directly. Alternatively, email editorial-team@simplywallst.com