
- LIVE QUOTES
- LEARN
- HELP
 Nasdaq
 Wall Street Journal
EN
Is Puma (XTRA:PUM) Now An Opportunity After Years Of Share Price Weakness?
- If you are looking at PUMA and asking whether the current share price reflects the true value of the business, this article is designed to walk you through that question step by step.
- PUMA's share price recently closed at €22.28, with returns of 0.1% over 7 days, 5.0% over 30 days, a 0.5% decline year to date, and longer term declines of 47.9% over 1 year, 61.8% over 3 years, and 72.3% over 5 years. This may signal that the market is reassessing growth potential and risk.
- Recent headlines around PUMA have focused on broad sector themes such as changing consumer demand patterns, cost pressures in apparel and footwear, and how brands are positioning themselves globally. These developments help frame why the market may have adjusted its expectations, and they give useful context for thinking about what the current price might be implying.
- On our valuation checks, PUMA scores 3 out of 6, giving it a valuation score of 3. Next, we will look at how different methods such as discounted cash flow, multiples, and asset based approaches line up, before finishing with a more holistic way to judge whether that score really matches the story.
Find out why PUMA's -47.9% return over the last year is lagging behind its peers.
Approach 1: PUMA Discounted Cash Flow (DCF) Analysis
A Discounted Cash Flow, or DCF, model projects a company’s future cash flows and then discounts them back to today’s value to estimate what the business might be worth per share right now.
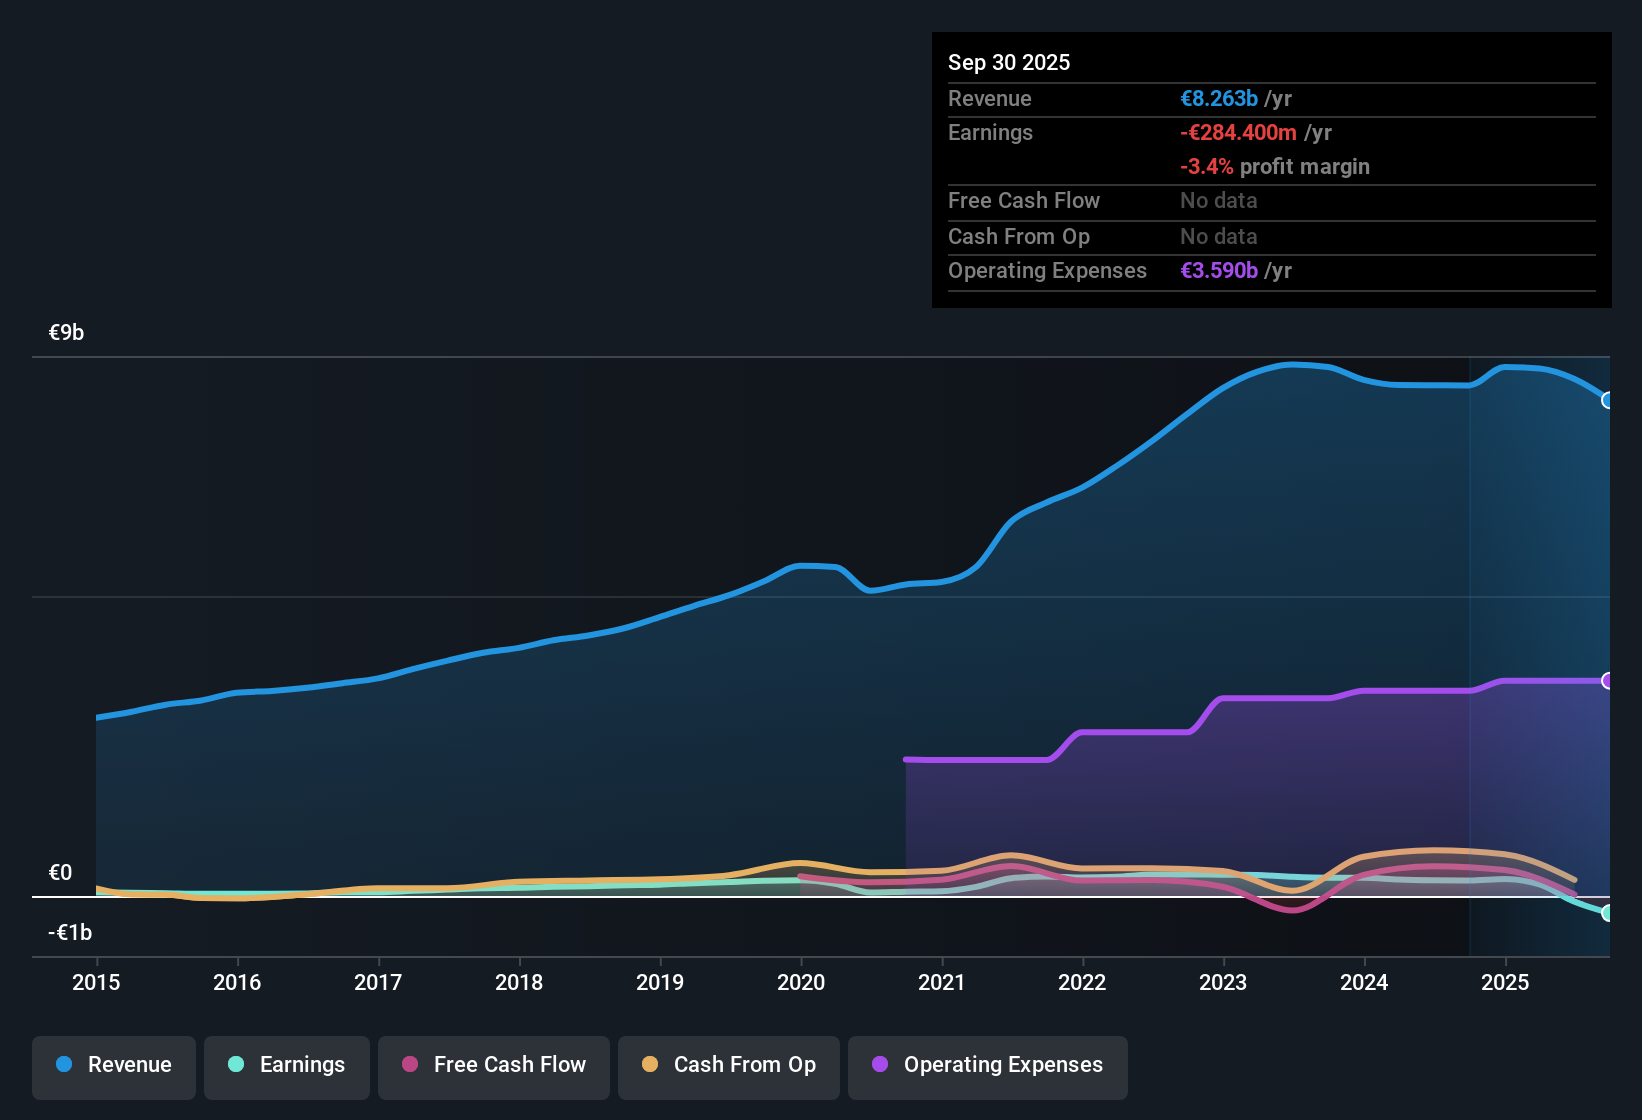
For PUMA, the model used is a 2 Stage Free Cash Flow to Equity approach. The latest twelve month free cash flow is reported as a loss of €13.39 million. Analysts provide explicit free cash flow estimates out to 2028, with projected free cash flow of €217.5 million in that year. Simply Wall St then extrapolates the path further using its own assumptions, resulting in a series of projected annual cash flows between about €211.78 million and €223.05 million on a discounted basis over the next decade.
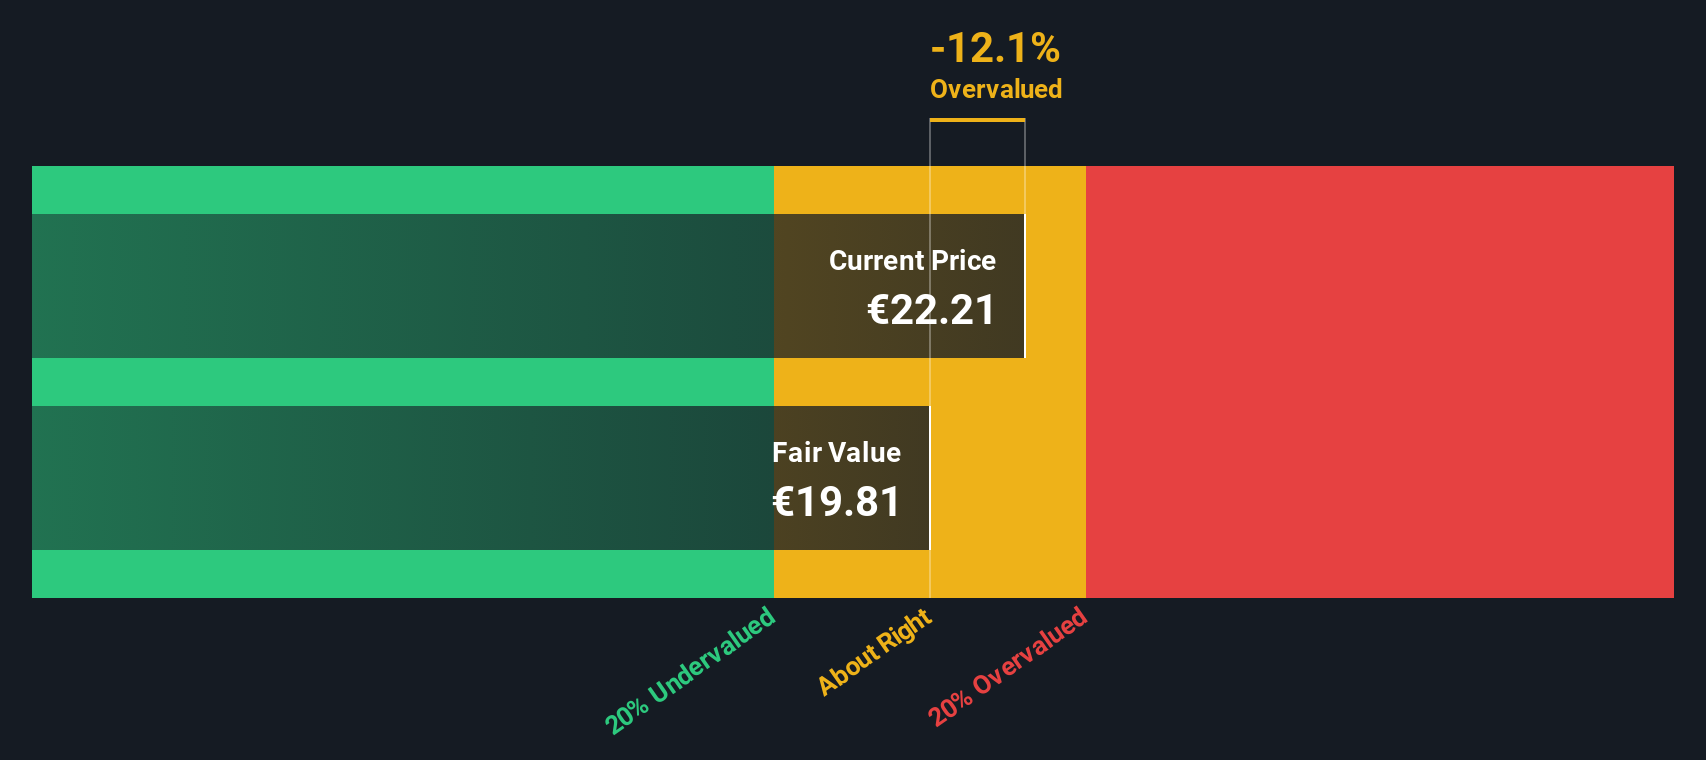
Discounting these projected cash flows back to today gives an estimated intrinsic value of €20.79 per share. Compared with the recent share price of €22.28, this suggests PUMA is around 7.2% overvalued on this DCF view, and the model indicates that the current price is slightly ahead of the underlying cash flow estimate.
Result: ABOUT RIGHT
PUMA is fairly valued according to our Discounted Cash Flow (DCF), but this can change at a moment's notice. Track the value in your watchlist or portfolio and be alerted on when to act.
Approach 2: PUMA Price vs Sales
For companies where earnings can be volatile, the P/S ratio is a useful way to anchor valuation to the revenue line. That revenue line tends to be more stable than profits. The P/S ratio tells you how much investors are paying for each euro of sales.
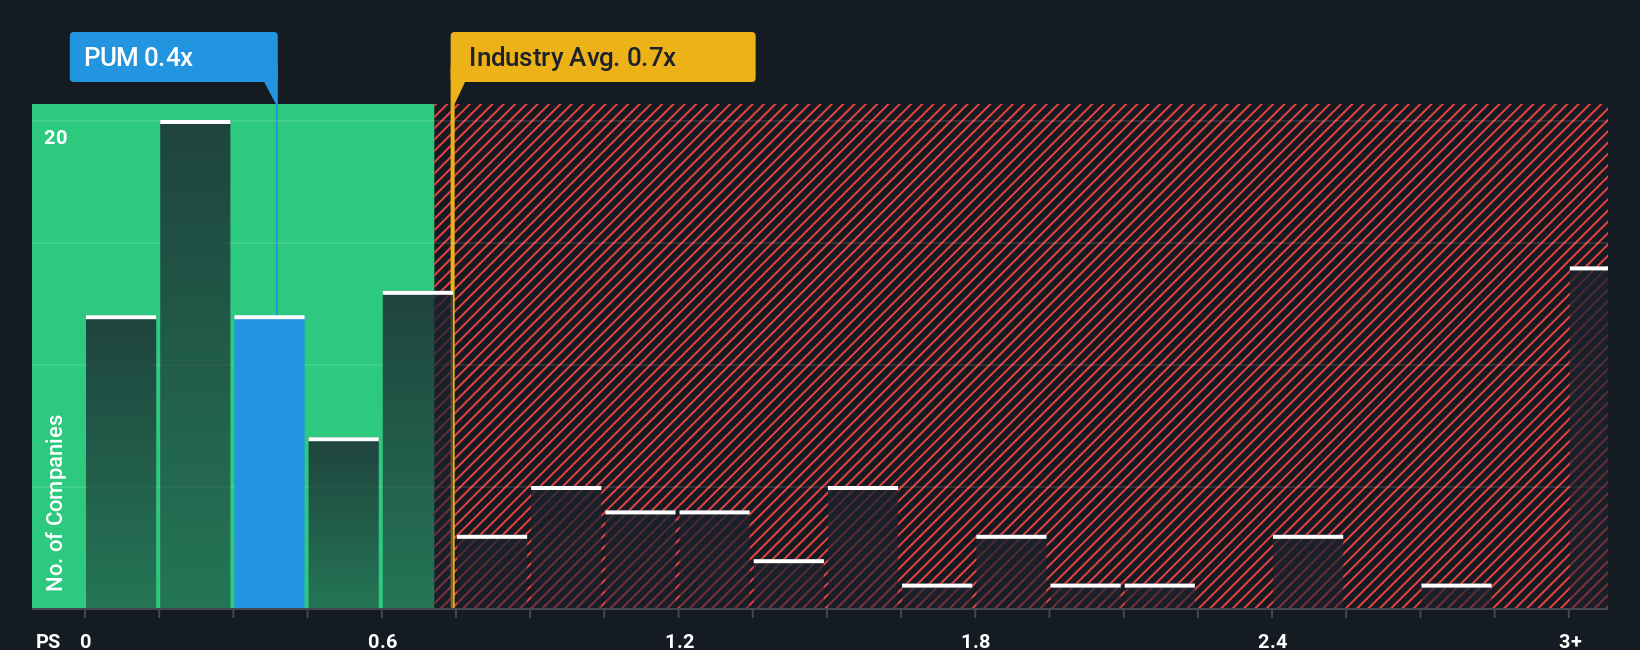
In general, higher expected growth and lower perceived risk can justify a higher “normal” or “fair” P/S multiple. Slower growth or higher uncertainty can justify a lower one. For PUMA, the current P/S ratio is 0.39x. This sits below the Luxury industry average of 0.83x and also below the peer group average of 0.89x.
Simply Wall St’s Fair Ratio for PUMA is 0.74x. This is a proprietary estimate of what PUMA’s P/S could be based on factors such as its earnings growth profile, industry, profit margins, market value and stock specific risks. Because it blends these company traits rather than just comparing to a broad industry or a handful of peers, it can give a more tailored reference point.
Comparing the Fair Ratio of 0.74x with the current P/S of 0.39x suggests the shares are trading below that tailored reference point.
Result: UNDERVALUED
P/S ratios tell one story, but what if the real opportunity lies elsewhere? Discover 1449 companies where insiders are betting big on explosive growth.
Upgrade Your Decision Making: Choose your PUMA Narrative
Earlier we mentioned that there is an even better way to understand valuation, so let us introduce you to Narratives, a simple way for you to attach a clear story about PUMA’s future to the numbers you are seeing, including your own view of fair value and your expectations for revenue, earnings and margins. A Narrative links what you believe about the company to a financial forecast, and then to a single fair value that you can compare with today’s share price to decide whether PUMA looks attractive or not right now. On Simply Wall St, Narratives sit inside the Community page and are used by millions of investors, so you can quickly see different viewpoints and how those translate into different fair values. Narratives also update when new information like results or news is added, so your view can stay current without you rebuilding a model each time. For PUMA, one investor might see a relatively low fair value based on cautious revenue growth and modest margins, while another might set a higher fair value based on stronger sales expectations and improved profitability.
Do you think there's more to the story for PUMA? Head over to our Community to see what others are saying!
This article by Simply Wall St is general in nature. We provide commentary based on historical data and analyst forecasts only using an unbiased methodology and our articles are not intended to be financial advice. It does not constitute a recommendation to buy or sell any stock, and does not take account of your objectives, or your financial situation. We aim to bring you long-term focused analysis driven by fundamental data. Note that our analysis may not factor in the latest price-sensitive company announcements or qualitative material. Simply Wall St has no position in any stocks mentioned.
Have feedback on this article? Concerned about the content? Get in touch with us directly. Alternatively, email editorial-team@simplywallst.com