
- LIVE QUOTES
- LEARN
- HELP
 Nasdaq
 Wall Street Journal
EN
FWD Group Holdings Limited's (HKG:1828): Senior Key Executive Tzar Kai Li is the most bullish insider, and their stock value gained 3.5% last week
Key Insights
- Significant insider control over FWD Group Holdings implies vested interests in company growth
- Tzar Kai Li owns 66% of the company
- Ownership research, combined with past performance data can help provide a good understanding of opportunities in a stock
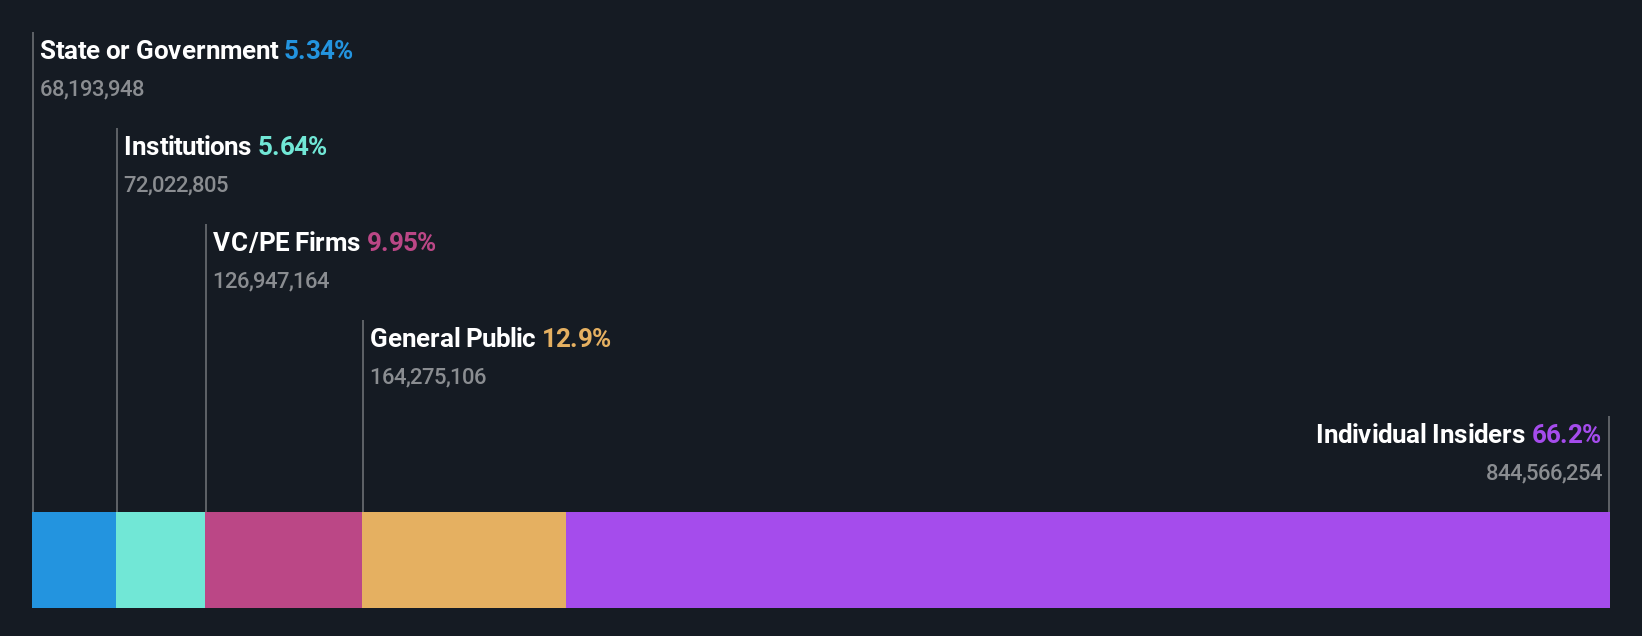
To get a sense of who is truly in control of FWD Group Holdings Limited (HKG:1828), it is important to understand the ownership structure of the business. And the group that holds the biggest piece of the pie are individual insiders with 66% ownership. Put another way, the group faces the maximum upside potential (or downside risk).
As a result, insiders were the biggest beneficiaries of last week’s 3.5% gain.
Let's delve deeper into each type of owner of FWD Group Holdings, beginning with the chart below.
See our latest analysis for FWD Group Holdings
What Does The Institutional Ownership Tell Us About FWD Group Holdings?
Institutions typically measure themselves against a benchmark when reporting to their own investors, so they often become more enthusiastic about a stock once it's included in a major index. We would expect most companies to have some institutions on the register, especially if they are growing.
As you can see, institutional investors have a fair amount of stake in FWD Group Holdings. This suggests some credibility amongst professional investors. But we can't rely on that fact alone since institutions make bad investments sometimes, just like everyone does. When multiple institutions own a stock, there's always a risk that they are in a 'crowded trade'. When such a trade goes wrong, multiple parties may compete to sell stock fast. This risk is higher in a company without a history of growth. You can see FWD Group Holdings' historic earnings and revenue below, but keep in mind there's always more to the story.

We note that hedge funds don't have a meaningful investment in FWD Group Holdings. Our data suggests that Tzar Kai Li, who is also the company's Senior Key Executive, holds the most number of shares at 66%. When an insider holds a sizeable amount of a company's stock, investors consider it as a positive sign because it suggests that insiders are willing to have their wealth tied up in the future of the company. For context, the second largest shareholder holds about 9.9% of the shares outstanding, followed by an ownership of 5.6% by the third-largest shareholder.
While it makes sense to study institutional ownership data for a company, it also makes sense to study analyst sentiments to know which way the wind is blowing. There is a little analyst coverage of the stock, but not much. So there is room for it to gain more coverage.
Insider Ownership Of FWD Group Holdings
While the precise definition of an insider can be subjective, almost everyone considers board members to be insiders. The company management answer to the board and the latter should represent the interests of shareholders. Notably, sometimes top-level managers are on the board themselves.
Insider ownership is positive when it signals leadership are thinking like the true owners of the company. However, high insider ownership can also give immense power to a small group within the company. This can be negative in some circumstances.
Our information suggests that insiders own more than half of FWD Group Holdings Limited. This gives them effective control of the company. Given it has a market cap of HK$50b, that means insiders have a whopping HK$33b worth of shares in their own names. It is good to see this level of investment. You can check here to see if those insiders have been selling any of their shares.
General Public Ownership
The general public-- including retail investors -- own 13% stake in the company, and hence can't easily be ignored. While this size of ownership may not be enough to sway a policy decision in their favour, they can still make a collective impact on company policies.
Private Equity Ownership
Private equity firms hold a 9.9% stake in FWD Group Holdings. This suggests they can be influential in key policy decisions. Some might like this, because private equity are sometimes activists who hold management accountable. But other times, private equity is selling out, having taking the company public.
Next Steps:
I find it very interesting to look at who exactly owns a company. But to truly gain insight, we need to consider other information, too.
I like to dive deeper into how a company has performed in the past. You can find historic revenue and earnings in this detailed graph.
If you are like me, you may want to think about whether this company will grow or shrink. Luckily, you can check this free report showing analyst forecasts for its future.
NB: Figures in this article are calculated using data from the last twelve months, which refer to the 12-month period ending on the last date of the month the financial statement is dated. This may not be consistent with full year annual report figures.
Have feedback on this article? Concerned about the content? Get in touch with us directly. Alternatively, email editorial-team (at) simplywallst.com.
This article by Simply Wall St is general in nature. We provide commentary based on historical data and analyst forecasts only using an unbiased methodology and our articles are not intended to be financial advice. It does not constitute a recommendation to buy or sell any stock, and does not take account of your objectives, or your financial situation. We aim to bring you long-term focused analysis driven by fundamental data. Note that our analysis may not factor in the latest price-sensitive company announcements or qualitative material. Simply Wall St has no position in any stocks mentioned.