
- LIVE QUOTES
- LEARN
- HELP
 Nasdaq
 Wall Street Journal
EN
SEKONIX (KOSDAQ:053450) pops 27% this week, taking three-year gains to 28%
Investors can buy low cost index fund if they want to receive the average market return. But in any diversified portfolio of stocks, you'll see some that fall short of the average. That's what has happened with the SEKONIX Co., Ltd. (KOSDAQ:053450) share price. It's up 25% over three years, but that is below the market return. Zooming in, the stock is up a respectable 14% in the last year.
On the back of a solid 7-day performance, let's check what role the company's fundamentals have played in driving long term shareholder returns.
In his essay The Superinvestors of Graham-and-Doddsville Warren Buffett described how share prices do not always rationally reflect the value of a business. One imperfect but simple way to consider how the market perception of a company has shifted is to compare the change in the earnings per share (EPS) with the share price movement.
SEKONIX became profitable within the last three years. That would generally be considered a positive, so we'd expect the share price to be up.
The image below shows how EPS has tracked over time (if you click on the image you can see greater detail).
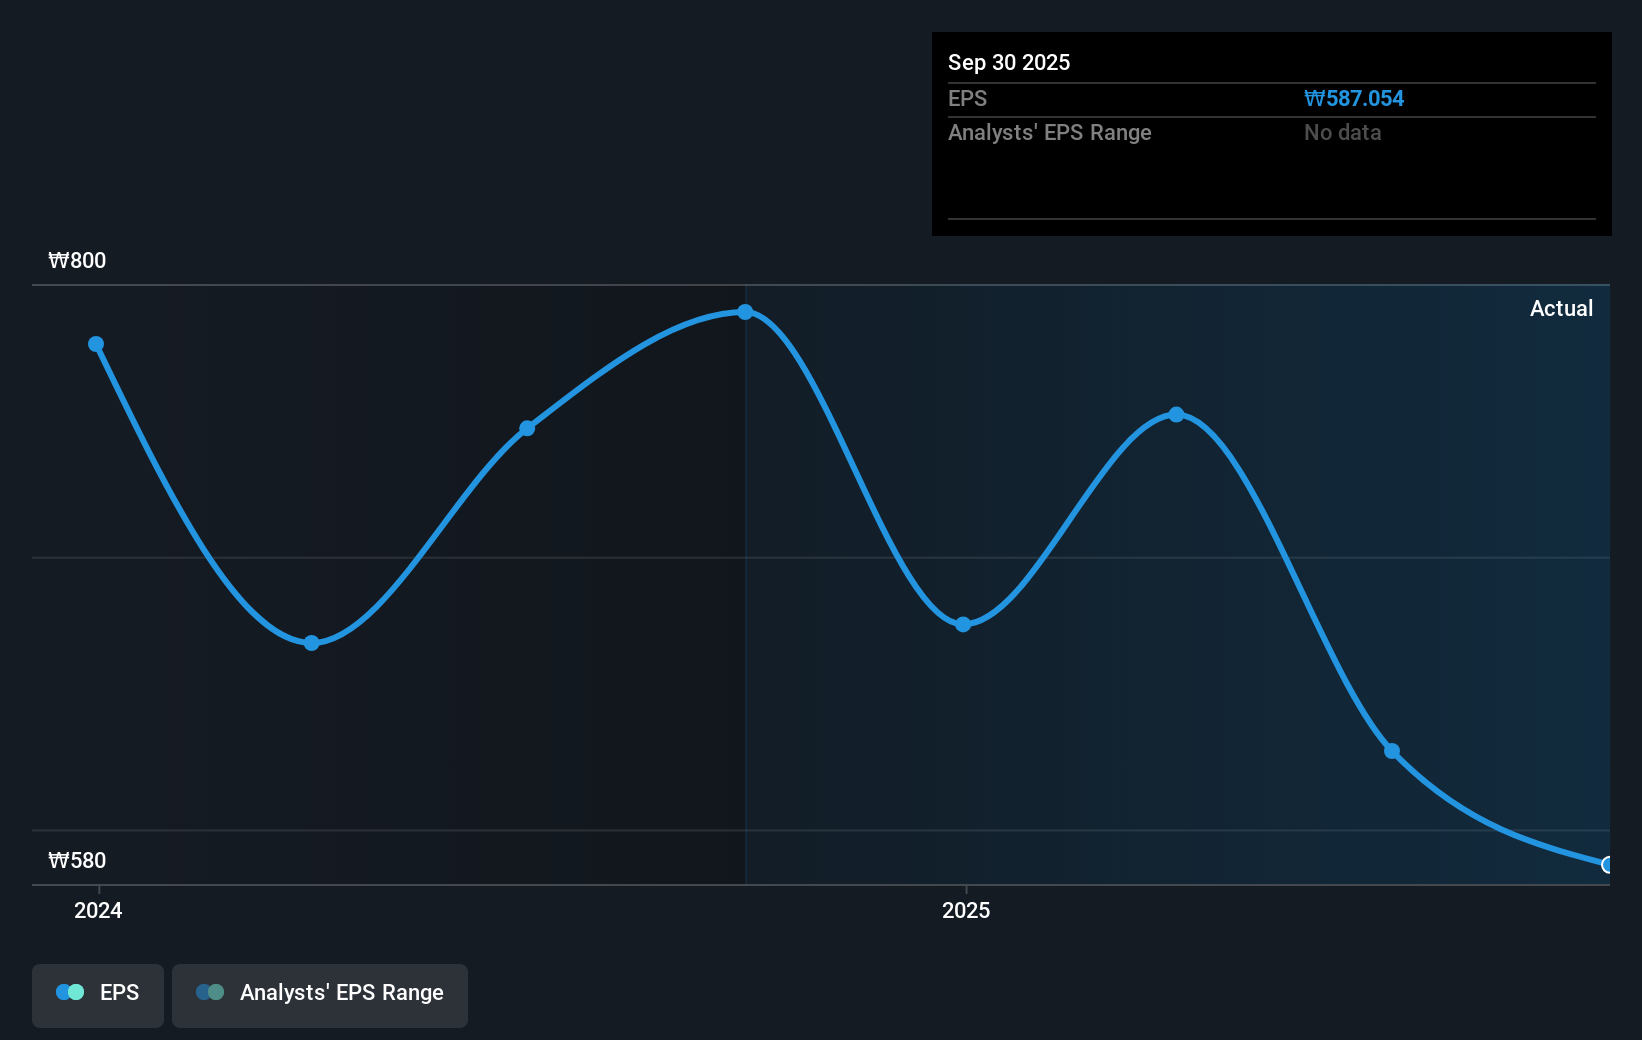
Dive deeper into SEKONIX's key metrics by checking this interactive graph of SEKONIX's earnings, revenue and cash flow.
What About Dividends?
When looking at investment returns, it is important to consider the difference between total shareholder return (TSR) and share price return. The TSR incorporates the value of any spin-offs or discounted capital raisings, along with any dividends, based on the assumption that the dividends are reinvested. It's fair to say that the TSR gives a more complete picture for stocks that pay a dividend. As it happens, SEKONIX's TSR for the last 3 years was 28%, which exceeds the share price return mentioned earlier. The dividends paid by the company have thusly boosted the total shareholder return.
A Different Perspective
SEKONIX provided a TSR of 14% over the last twelve months. But that was short of the market average. On the bright side, that's still a gain, and it is certainly better than the yearly loss of about 2% endured over half a decade. It could well be that the business is stabilizing. I find it very interesting to look at share price over the long term as a proxy for business performance. But to truly gain insight, we need to consider other information, too. Take risks, for example - SEKONIX has 2 warning signs (and 1 which makes us a bit uncomfortable) we think you should know about.
But note: SEKONIX may not be the best stock to buy. So take a peek at this free list of interesting companies with past earnings growth (and further growth forecast).
Please note, the market returns quoted in this article reflect the market weighted average returns of stocks that currently trade on South Korean exchanges.
Have feedback on this article? Concerned about the content? Get in touch with us directly. Alternatively, email editorial-team (at) simplywallst.com.
This article by Simply Wall St is general in nature. We provide commentary based on historical data and analyst forecasts only using an unbiased methodology and our articles are not intended to be financial advice. It does not constitute a recommendation to buy or sell any stock, and does not take account of your objectives, or your financial situation. We aim to bring you long-term focused analysis driven by fundamental data. Note that our analysis may not factor in the latest price-sensitive company announcements or qualitative material. Simply Wall St has no position in any stocks mentioned.