
- LIVE QUOTES
- LEARN
- HELP
 Nasdaq
 Wall Street Journal
EN
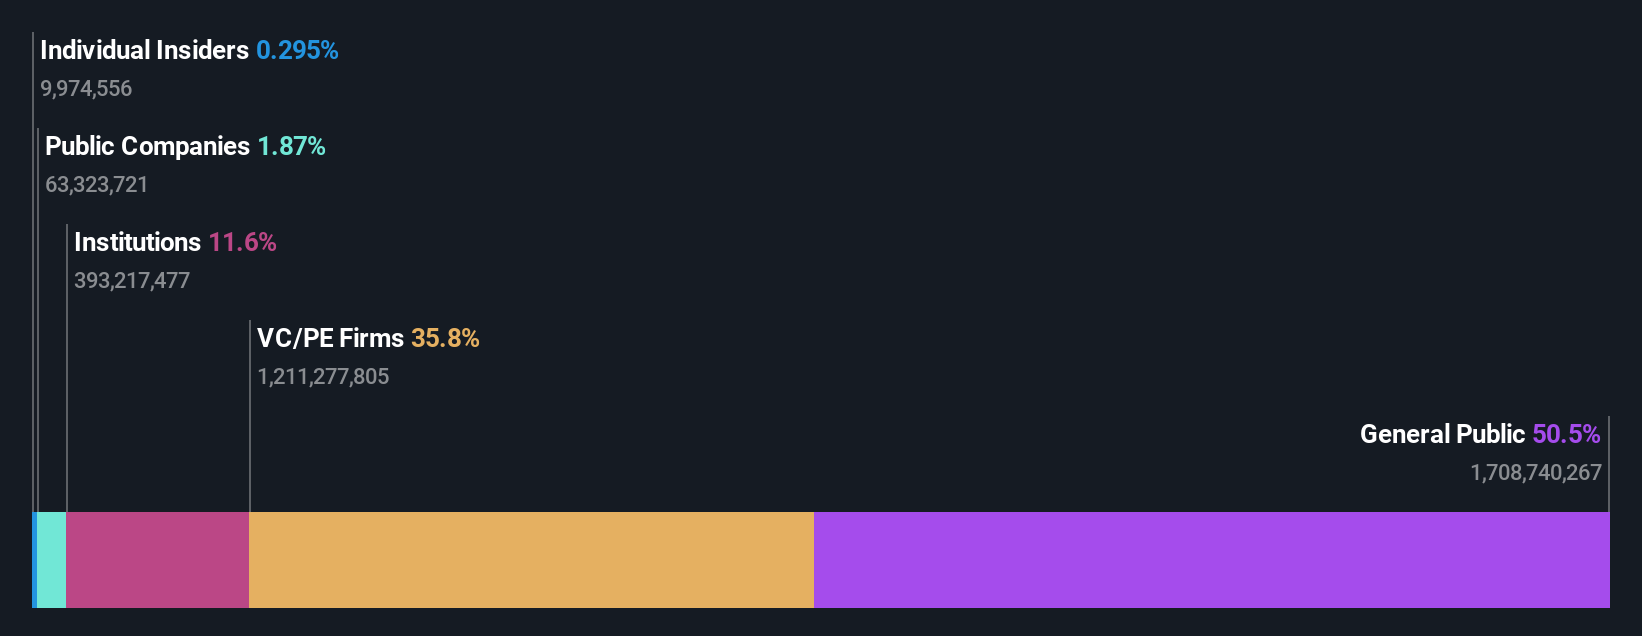
Seatrium Limited's (SGX:5E2) top owners are retail investors with 50% stake, while 36% is held by private equity firms
Key Insights
- Seatrium's significant retail investors ownership suggests that the key decisions are influenced by shareholders from the larger public
- A total of 25 investors have a majority stake in the company with 49% ownership
- 12% of Seatrium is held by Institutions
To get a sense of who is truly in control of Seatrium Limited (SGX:5E2), it is important to understand the ownership structure of the business. With 50% stake, retail investors possess the maximum shares in the company. Put another way, the group faces the maximum upside potential (or downside risk).
Private equity firms, on the other hand, account for 36% of the company's stockholders.
Let's take a closer look to see what the different types of shareholders can tell us about Seatrium.
See our latest analysis for Seatrium
What Does The Institutional Ownership Tell Us About Seatrium?
Institutional investors commonly compare their own returns to the returns of a commonly followed index. So they generally do consider buying larger companies that are included in the relevant benchmark index.
As you can see, institutional investors have a fair amount of stake in Seatrium. This suggests some credibility amongst professional investors. But we can't rely on that fact alone since institutions make bad investments sometimes, just like everyone does. When multiple institutions own a stock, there's always a risk that they are in a 'crowded trade'. When such a trade goes wrong, multiple parties may compete to sell stock fast. This risk is higher in a company without a history of growth. You can see Seatrium's historic earnings and revenue below, but keep in mind there's always more to the story.

We note that hedge funds don't have a meaningful investment in Seatrium. The company's largest shareholder is Temasek Holdings (Private) Limited, with ownership of 36%. The Vanguard Group, Inc. is the second largest shareholder owning 2.4% of common stock, and Keppel Ltd. holds about 1.9% of the company stock.
Our studies suggest that the top 25 shareholders collectively control less than half of the company's shares, meaning that the company's shares are widely disseminated and there is no dominant shareholder.
Researching institutional ownership is a good way to gauge and filter a stock's expected performance. The same can be achieved by studying analyst sentiments. There are plenty of analysts covering the stock, so it might be worth seeing what they are forecasting, too.
Insider Ownership Of Seatrium
While the precise definition of an insider can be subjective, almost everyone considers board members to be insiders. Management ultimately answers to the board. However, it is not uncommon for managers to be executive board members, especially if they are a founder or the CEO.
I generally consider insider ownership to be a good thing. However, on some occasions it makes it more difficult for other shareholders to hold the board accountable for decisions.
Our most recent data indicates that insiders own less than 1% of Seatrium Limited. It is a pretty big company, so it would be possible for board members to own a meaningful interest in the company, without owning much of a proportional interest. In this case, they own around S$22m worth of shares (at current prices). It is always good to see at least some insider ownership, but it might be worth checking if those insiders have been selling.
General Public Ownership
The general public, mostly comprising of individual investors, collectively holds 50% of Seatrium shares. This size of ownership gives investors from the general public some collective power. They can and probably do influence decisions on executive compensation, dividend policies and proposed business acquisitions.
Private Equity Ownership
With a stake of 36%, private equity firms could influence the Seatrium board. Sometimes we see private equity stick around for the long term, but generally speaking they have a shorter investment horizon and -- as the name suggests -- don't invest in public companies much. After some time they may look to sell and redeploy capital elsewhere.
Next Steps:
While it is well worth considering the different groups that own a company, there are other factors that are even more important.
I like to dive deeper into how a company has performed in the past. You can access this interactive graph of past earnings, revenue and cash flow, for free.
If you would prefer discover what analysts are predicting in terms of future growth, do not miss this free report on analyst forecasts.
NB: Figures in this article are calculated using data from the last twelve months, which refer to the 12-month period ending on the last date of the month the financial statement is dated. This may not be consistent with full year annual report figures.
Have feedback on this article? Concerned about the content? Get in touch with us directly. Alternatively, email editorial-team (at) simplywallst.com.
This article by Simply Wall St is general in nature. We provide commentary based on historical data and analyst forecasts only using an unbiased methodology and our articles are not intended to be financial advice. It does not constitute a recommendation to buy or sell any stock, and does not take account of your objectives, or your financial situation. We aim to bring you long-term focused analysis driven by fundamental data. Note that our analysis may not factor in the latest price-sensitive company announcements or qualitative material. Simply Wall St has no position in any stocks mentioned.