
- LIVE QUOTES
- LEARN
- HELP


EN
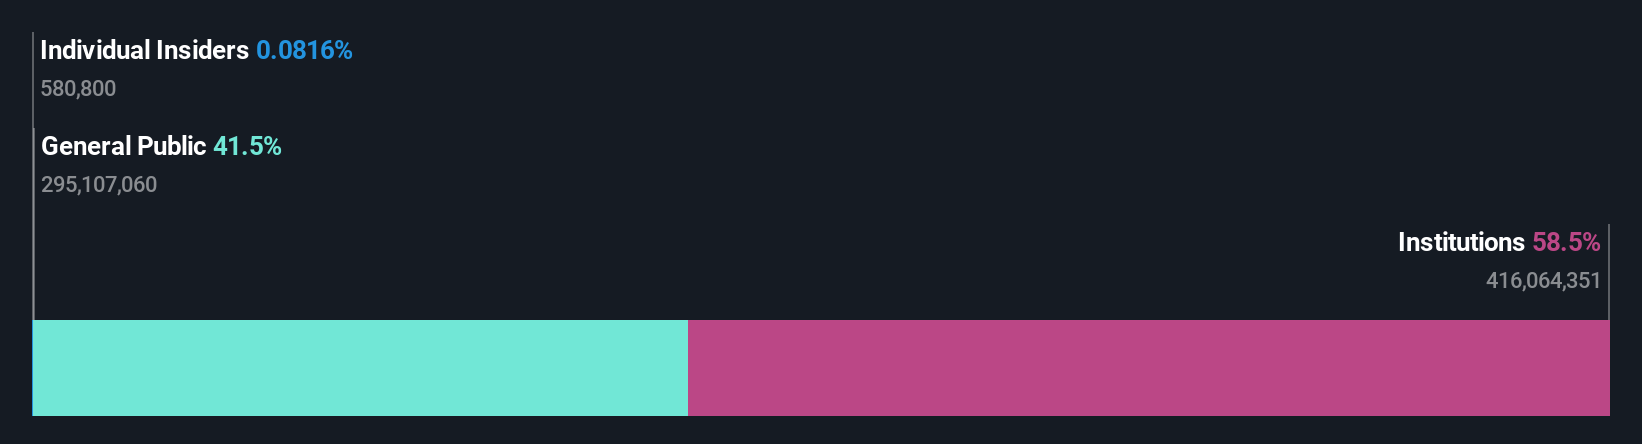
Institutional investors have a lot riding on ASICS Corporation (TSE:7936) with 58% ownership
Key Insights
- Significantly high institutional ownership implies ASICS' stock price is sensitive to their trading actions
- 50% of the business is held by the top 23 shareholders
- Analyst forecasts along with ownership data serve to give a strong idea about prospects for a business
If you want to know who really controls ASICS Corporation (TSE:7936), then you'll have to look at the makeup of its share registry. We can see that institutions own the lion's share in the company with 58% ownership. In other words, the group stands to gain the most (or lose the most) from their investment into the company.
And last week, institutional investors ended up benefitting the most after the company hit JP¥2.8t in market cap. One-year return to shareholders is currently 30% and last week’s gain was the icing on the cake.
Let's take a closer look to see what the different types of shareholders can tell us about ASICS.
View our latest analysis for ASICS
What Does The Institutional Ownership Tell Us About ASICS?
Institutional investors commonly compare their own returns to the returns of a commonly followed index. So they generally do consider buying larger companies that are included in the relevant benchmark index.
We can see that ASICS does have institutional investors; and they hold a good portion of the company's stock. This can indicate that the company has a certain degree of credibility in the investment community. However, it is best to be wary of relying on the supposed validation that comes with institutional investors. They too, get it wrong sometimes. When multiple institutions own a stock, there's always a risk that they are in a 'crowded trade'. When such a trade goes wrong, multiple parties may compete to sell stock fast. This risk is higher in a company without a history of growth. You can see ASICS' historic earnings and revenue below, but keep in mind there's always more to the story.

Since institutional investors own more than half the issued stock, the board will likely have to pay attention to their preferences. Hedge funds don't have many shares in ASICS. The company's largest shareholder is BlackRock, Inc., with ownership of 7.5%. Nomura Asset Management Co., Ltd. is the second largest shareholder owning 5.2% of common stock, and The Vanguard Group, Inc. holds about 3.9% of the company stock.
Looking at the shareholder registry, we can see that 50% of the ownership is controlled by the top 23 shareholders, meaning that no single shareholder has a majority interest in the ownership.
While it makes sense to study institutional ownership data for a company, it also makes sense to study analyst sentiments to know which way the wind is blowing. Quite a few analysts cover the stock, so you could look into forecast growth quite easily.
Insider Ownership Of ASICS
The definition of company insiders can be subjective and does vary between jurisdictions. Our data reflects individual insiders, capturing board members at the very least. Management ultimately answers to the board. However, it is not uncommon for managers to be executive board members, especially if they are a founder or the CEO.
I generally consider insider ownership to be a good thing. However, on some occasions it makes it more difficult for other shareholders to hold the board accountable for decisions.
Our most recent data indicates that insiders own less than 1% of ASICS Corporation. It is a very large company, so it would be surprising to see insiders own a large proportion of the company. Though their holding amounts to less than 1%, we can see that board members collectively own JP¥2.3b worth of shares (at current prices). Arguably recent buying and selling is just as important to consider. You can click here to see if insiders have been buying or selling.
General Public Ownership
With a 41% ownership, the general public, mostly comprising of individual investors, have some degree of sway over ASICS. This size of ownership, while considerable, may not be enough to change company policy if the decision is not in sync with other large shareholders.
Next Steps:
I find it very interesting to look at who exactly owns a company. But to truly gain insight, we need to consider other information, too.
I like to dive deeper into how a company has performed in the past. You can access this interactive graph of past earnings, revenue and cash flow, for free.
But ultimately it is the future, not the past, that will determine how well the owners of this business will do. Therefore we think it advisable to take a look at this free report showing whether analysts are predicting a brighter future.
NB: Figures in this article are calculated using data from the last twelve months, which refer to the 12-month period ending on the last date of the month the financial statement is dated. This may not be consistent with full year annual report figures.
Have feedback on this article? Concerned about the content? Get in touch with us directly. Alternatively, email editorial-team (at) simplywallst.com.
This article by Simply Wall St is general in nature. We provide commentary based on historical data and analyst forecasts only using an unbiased methodology and our articles are not intended to be financial advice. It does not constitute a recommendation to buy or sell any stock, and does not take account of your objectives, or your financial situation. We aim to bring you long-term focused analysis driven by fundamental data. Note that our analysis may not factor in the latest price-sensitive company announcements or qualitative material. Simply Wall St has no position in any stocks mentioned.