
- LIVE QUOTES
- LEARN
- HELP
 Nasdaq
 Wall Street Journal
EN
With 37% ownership in Fukuda Denshi Co., Ltd. (TSE:6960), institutional investors have a lot riding on the business
Key Insights
- Given the large stake in the stock by institutions, Fukuda Denshi's stock price might be vulnerable to their trading decisions
- The top 9 shareholders own 51% of the company
- Insider ownership in Fukuda Denshi is 14%
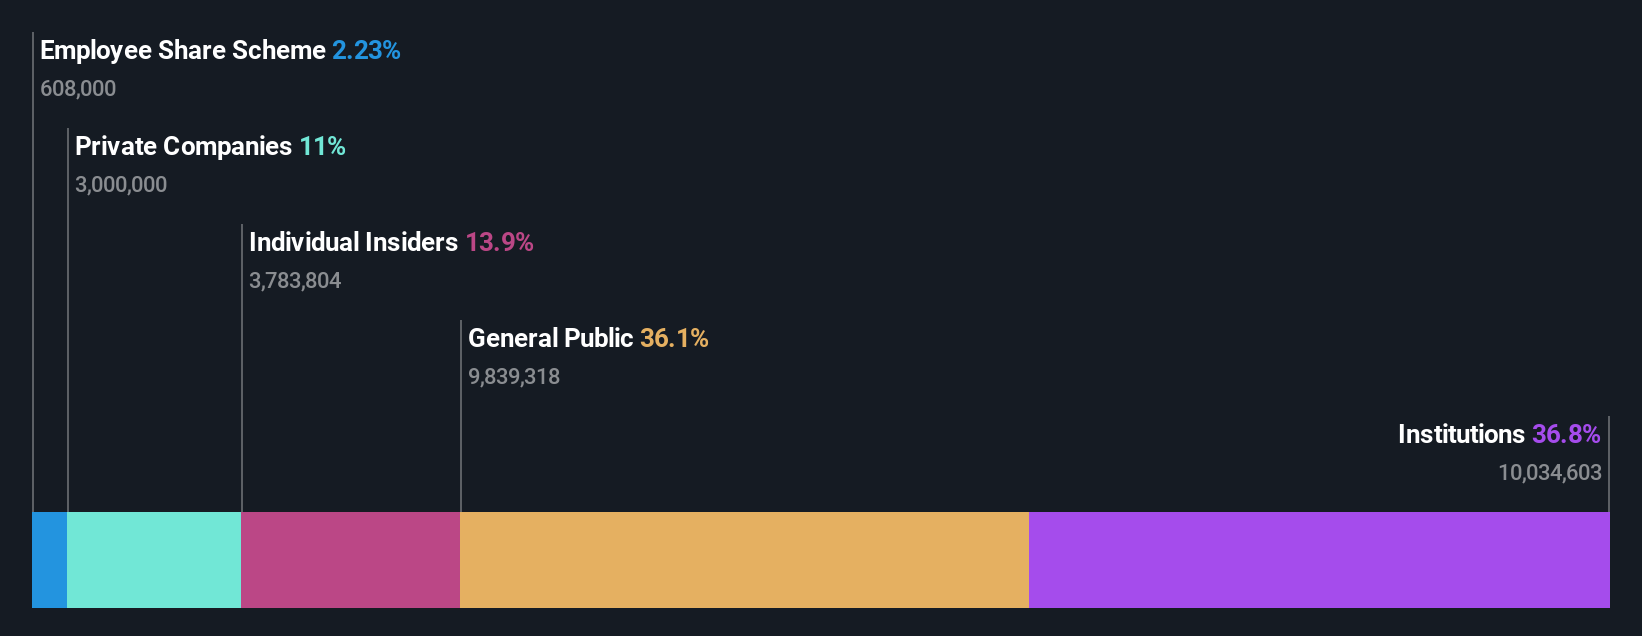
A look at the shareholders of Fukuda Denshi Co., Ltd. (TSE:6960) can tell us which group is most powerful. We can see that institutions own the lion's share in the company with 37% ownership. That is, the group stands to benefit the most if the stock rises (or lose the most if there is a downturn).
And things are looking up for institutional investors after the company gained JP¥13b in market cap last week. One-year return to shareholders is currently 17% and last week’s gain was the icing on the cake.
In the chart below, we zoom in on the different ownership groups of Fukuda Denshi.
See our latest analysis for Fukuda Denshi
What Does The Institutional Ownership Tell Us About Fukuda Denshi?
Many institutions measure their performance against an index that approximates the local market. So they usually pay more attention to companies that are included in major indices.
Fukuda Denshi already has institutions on the share registry. Indeed, they own a respectable stake in the company. This can indicate that the company has a certain degree of credibility in the investment community. However, it is best to be wary of relying on the supposed validation that comes with institutional investors. They too, get it wrong sometimes. If multiple institutions change their view on a stock at the same time, you could see the share price drop fast. It's therefore worth looking at Fukuda Denshi's earnings history below. Of course, the future is what really matters.

We note that hedge funds don't have a meaningful investment in Fukuda Denshi. Our data shows that Century Industries Co., Ltd. is the largest shareholder with 11% of shares outstanding. With 10.0% and 5.5% of the shares outstanding respectively, Kotaro Fukuda and Nissay Asset Management Corporation are the second and third largest shareholders. Kotaro Fukuda, who is the second-largest shareholder, also happens to hold the title of Chief Executive Officer.
We also observed that the top 9 shareholders account for more than half of the share register, with a few smaller shareholders to balance the interests of the larger ones to a certain extent.
Researching institutional ownership is a good way to gauge and filter a stock's expected performance. The same can be achieved by studying analyst sentiments. There is some analyst coverage of the stock, but it could still become more well known, with time.
Insider Ownership Of Fukuda Denshi
The definition of company insiders can be subjective and does vary between jurisdictions. Our data reflects individual insiders, capturing board members at the very least. Management ultimately answers to the board. However, it is not uncommon for managers to be executive board members, especially if they are a founder or the CEO.
Most consider insider ownership a positive because it can indicate the board is well aligned with other shareholders. However, on some occasions too much power is concentrated within this group.
Our information suggests that insiders maintain a significant holding in Fukuda Denshi Co., Ltd.. It is very interesting to see that insiders have a meaningful JP¥30b stake in this JP¥219b business. Most would be pleased to see the board is investing alongside them. You may wish to access this free chart showing recent trading by insiders.
General Public Ownership
The general public, who are usually individual investors, hold a 36% stake in Fukuda Denshi. This size of ownership, while considerable, may not be enough to change company policy if the decision is not in sync with other large shareholders.
Private Company Ownership
It seems that Private Companies own 11%, of the Fukuda Denshi stock. It's hard to draw any conclusions from this fact alone, so its worth looking into who owns those private companies. Sometimes insiders or other related parties have an interest in shares in a public company through a separate private company.
Next Steps:
I find it very interesting to look at who exactly owns a company. But to truly gain insight, we need to consider other information, too.
I like to dive deeper into how a company has performed in the past. You can find historic revenue and earnings in this detailed graph.
If you are like me, you may want to think about whether this company will grow or shrink. Luckily, you can check this free report showing analyst forecasts for its future.
NB: Figures in this article are calculated using data from the last twelve months, which refer to the 12-month period ending on the last date of the month the financial statement is dated. This may not be consistent with full year annual report figures.
Have feedback on this article? Concerned about the content? Get in touch with us directly. Alternatively, email editorial-team (at) simplywallst.com.
This article by Simply Wall St is general in nature. We provide commentary based on historical data and analyst forecasts only using an unbiased methodology and our articles are not intended to be financial advice. It does not constitute a recommendation to buy or sell any stock, and does not take account of your objectives, or your financial situation. We aim to bring you long-term focused analysis driven by fundamental data. Note that our analysis may not factor in the latest price-sensitive company announcements or qualitative material. Simply Wall St has no position in any stocks mentioned.