
- LIVE QUOTES
- LEARN
- HELP
 Nasdaq
 Wall Street Journal
EN
A Look At Amentum Holdings (AMTM) Valuation After Recent Share Price Momentum
Amentum Holdings event driven snapshot
Amentum Holdings (AMTM) has drawn fresh attention after recent trading, with the stock closing at $31.44 and posting returns of 3.1% over the day and 7.3% over the past week.
See our latest analysis for Amentum Holdings.
The recent 3.1% 1 day share price return and 7.3% 7 day share price return sit alongside a 90 day share price return of 24.5% and a 1 year total shareholder return of 42.3%, which together suggest building momentum rather than fading interest.
If Amentum has caught your eye, it could be a good moment to see what else is moving and compare it with aerospace and defense stocks.
With Amentum posting double digit returns over the past quarter and trading at $31.44 against an analyst target of about $33.73, the central question is whether the sizeable intrinsic discount signals opportunity or if the market is already pricing in future growth.
Price to earnings of 116.1x: Is it justified?
Amentum's current P/E of 116.1x, against a last close of $31.44, points to a share price that is rich compared with several benchmarks.
The P/E ratio compares the share price to earnings per share and is often used for service and engineering companies where profits are a key focus. A higher P/E typically reflects investors paying more for each dollar of current earnings.
For Amentum, the current 116.1x P/E stands far above the US Professional Services industry average of 24x and the peer average of 19.1x. This suggests the market is pricing in materially higher earnings power than those groups. It also sits well above the estimated fair P/E of 37x. This is a level the market could potentially move towards if expectations and reported earnings converge over time.
Explore the SWS fair ratio for Amentum Holdings
Result: Price-to-earnings of 116.1x (OVERVALUED)
However, the high 116.1x P/E and relatively modest annual revenue growth of 2.8% leave little room for disappointment if earnings or contract wins fall short.
Find out about the key risks to this Amentum Holdings narrative.
Another view on value: DCF says the story is very different
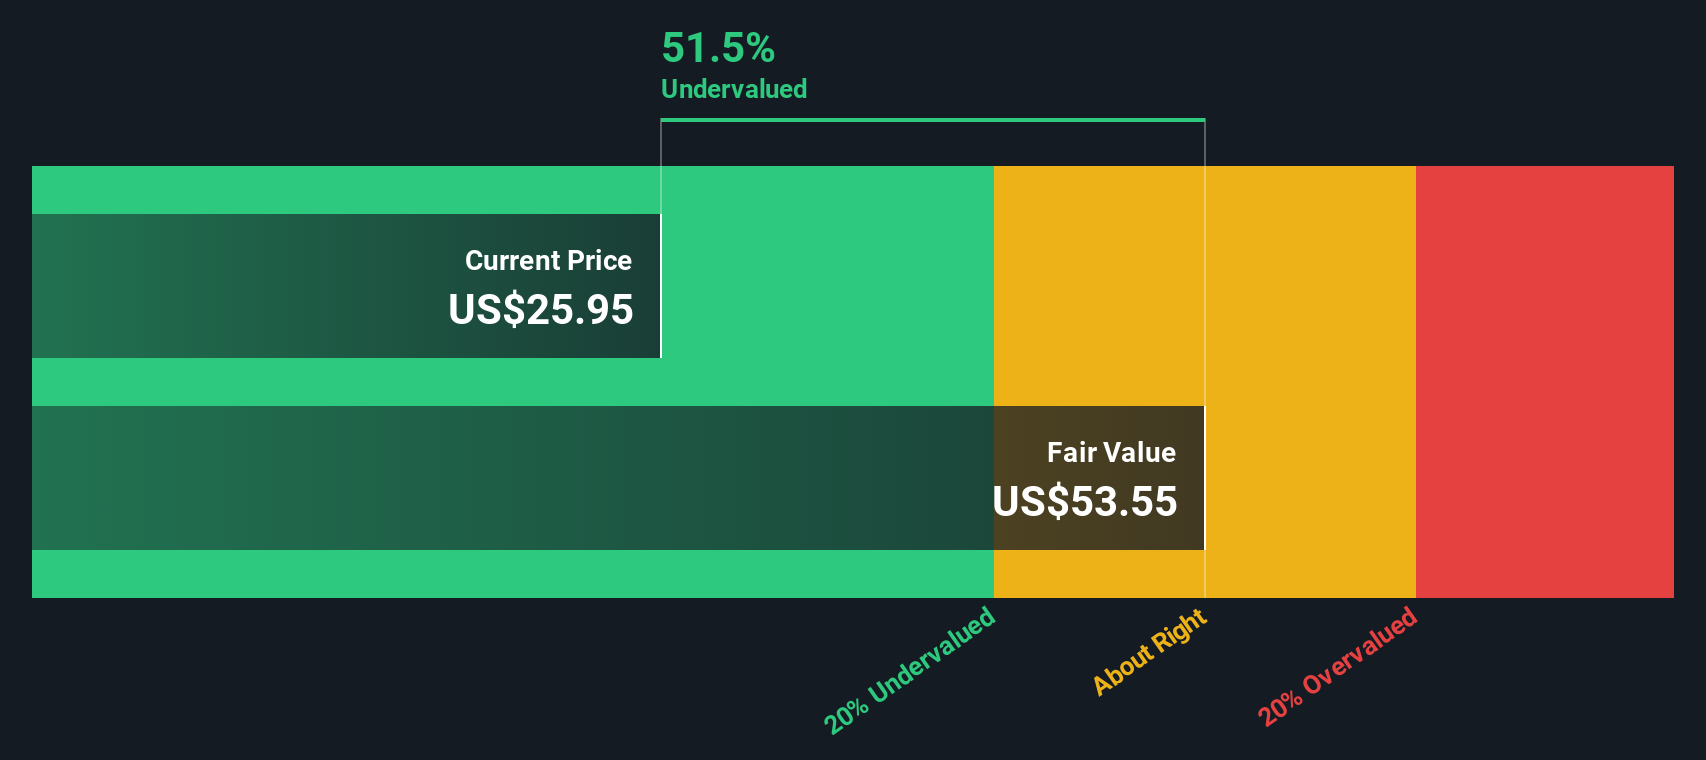
The high 116.1x P/E paints Amentum as expensive, but our DCF model points in the opposite direction. On that view, the shares at $31.44 are trading about 54.1% below an estimated fair value of $68.45, which frames the current price as a sizeable discount instead of a premium.
DCF puts most of the weight on future cash flows rather than today’s earnings multiple, so the gap between the 116.1x P/E and a DCF fair value estimate raises a simple question for you: which set of assumptions do you trust more right now?
Look into how the SWS DCF model arrives at its fair value.
Simply Wall St performs a discounted cash flow (DCF) on every stock in the world every day (check out Amentum Holdings for example). We show the entire calculation in full. You can track the result in your watchlist or portfolio and be alerted when this changes, or use our stock screener to discover 880 undervalued stocks based on their cash flows. If you save a screener we even alert you when new companies match - so you never miss a potential opportunity.
Build Your Own Amentum Holdings Narrative
If you see the data differently or prefer to piece together your own view, you can build a full Amentum story yourself in just a few minutes, starting with Do it your way.
A great starting point for your Amentum Holdings research is our analysis highlighting 3 key rewards and 2 important warning signs that could impact your investment decision.
Ready for more investment ideas?
If Amentum feels interesting, do not stop here. The real edge often comes from comparing a few different opportunities side by side using focused stock ideas.
Use the Simply Wall Street Screener to quickly scan for other opportunities that match what you care about most and keep your watchlist fresh, not reactive.
- Target potential bargains by focusing on companies trading below their estimated cash flow value through these 880 undervalued stocks based on cash flows that may suit value focused investors.
- Spot growth potential in cutting edge automation and machine learning by reviewing these 25 AI penny stocks that could reshape how entire industries operate.
- Tap into income focused opportunities by checking out these 14 dividend stocks with yields > 3% that can help you build a more reliable cash return profile.
This article by Simply Wall St is general in nature. We provide commentary based on historical data and analyst forecasts only using an unbiased methodology and our articles are not intended to be financial advice. It does not constitute a recommendation to buy or sell any stock, and does not take account of your objectives, or your financial situation. We aim to bring you long-term focused analysis driven by fundamental data. Note that our analysis may not factor in the latest price-sensitive company announcements or qualitative material. Simply Wall St has no position in any stocks mentioned.
Have feedback on this article? Concerned about the content? Get in touch with us directly. Alternatively, email editorial-team@simplywallst.com