
- LIVE QUOTES
- LEARN
- HELP
 Nasdaq
 Wall Street Journal
EN
Is Comcast (CMCSA) Pricing Look Interesting After Recent Share Price Weakness
- If you are wondering whether Comcast's current share price reflects its true worth, this breakdown will help you connect the recent moves in the stock with what the underlying valuation is saying.
- The shares last closed at US$28.13, with a 6.1% decline over the past week, a 3.0% gain over the past month, and returns of 4.8% decline year to date, 16.2% decline over 1 year, 13.4% decline over 3 years, and 31.3% decline over 5 years.
- These mixed returns have kept Comcast on many investors' watchlists, as they weigh the appeal of a well known media and broadband name against changing expectations for the sector. Recent coverage has focused on how investors are reassessing mature media and connectivity businesses, which is an important backdrop when thinking about what a fair price for Comcast might be.
- In that context, Comcast currently scores a 6 / 6 valuation check score. Next, we will walk through the key valuation methods behind that score, then finish with a simple way to pull all those signals together into one view you can track over time.
Find out why Comcast's -16.2% return over the last year is lagging behind its peers.
Approach 1: Comcast Discounted Cash Flow (DCF) Analysis
Approach 1: Comcast Discounted Cash Flow (DCF) Analysis
A Discounted Cash Flow, or DCF, model looks at the cash Comcast is expected to generate in the future and then discounts those projected cash flows back to what they might be worth in today’s dollars.
For Comcast, the model used is a 2 Stage Free Cash Flow to Equity approach, based on cash flow projections. The latest twelve month Free Cash Flow is about $17.6b, and analysts and extrapolated estimates point to Free Cash Flow of about $20.2b in 2035. Simply Wall St uses analyst inputs where available, then extends the series beyond the formal forecast period.
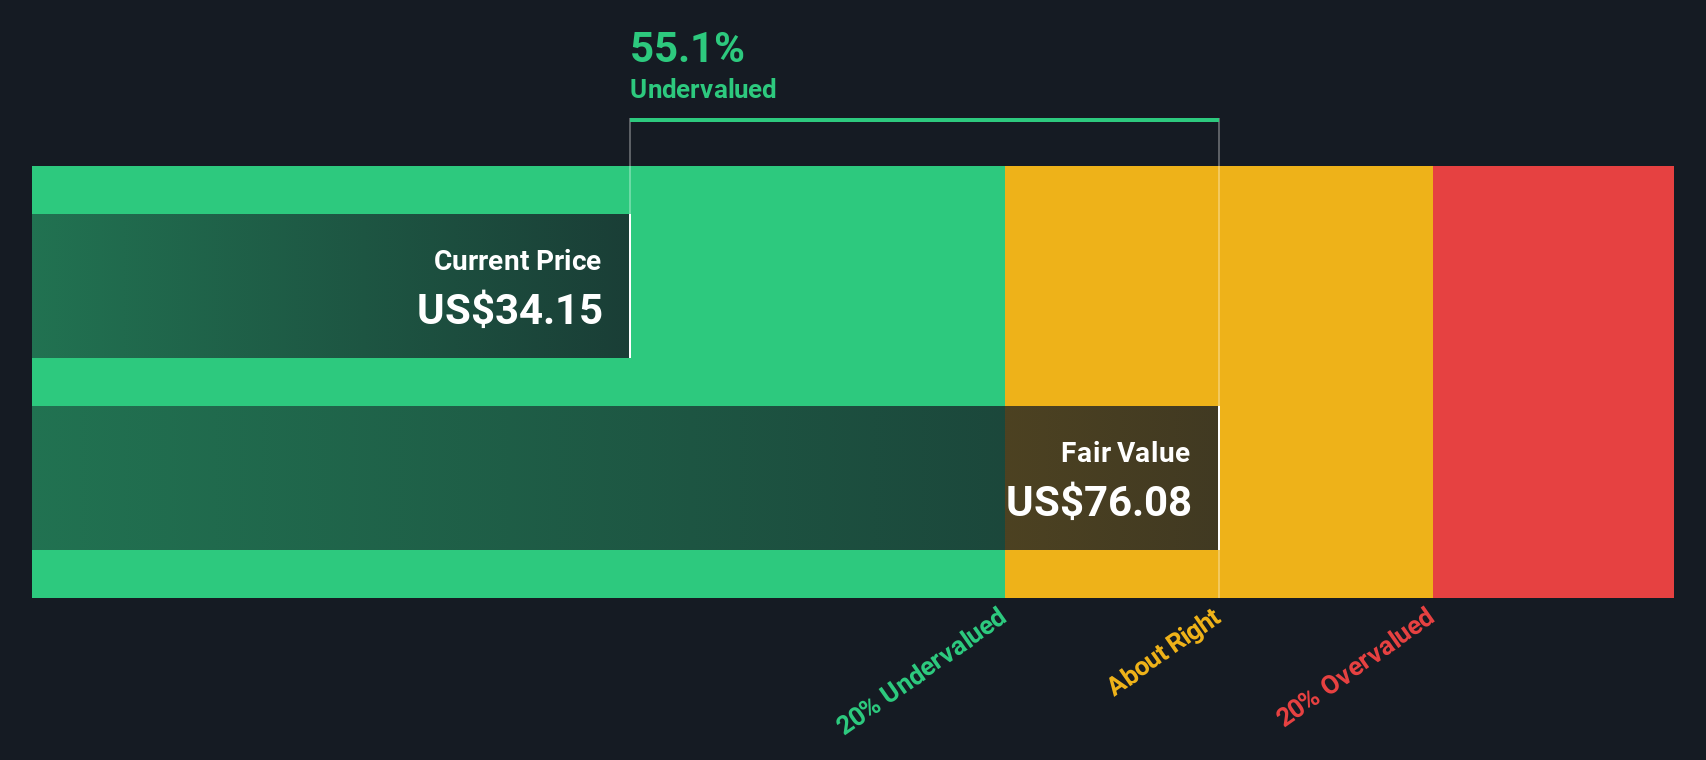
When those projected cash flows are discounted back, the DCF model suggests an intrinsic value of about $87.92 per share. Compared with the recent share price of $28.13, this implies the stock is about 68.0% below that DCF estimate. This outcome points to Comcast trading at a steep discount based on this method alone.
Result: UNDERVALUED
Our Discounted Cash Flow (DCF) analysis suggests Comcast is undervalued by 68.0%. Track this in your watchlist or portfolio, or discover 879 more undervalued stocks based on cash flows.
Approach 2: Comcast Price vs Earnings
Approach 2: Comcast Price vs Earnings
For a company that is generating profits, the P/E ratio is a straightforward way to link the share price to the earnings backing each share. It gives you a quick sense of how many dollars investors are currently paying for each dollar of earnings.
What counts as a “normal” P/E depends on what investors expect for future growth and how much risk they see in those earnings. Higher expected growth or lower perceived risk can justify a higher multiple, while weaker growth or higher risk usually goes with a lower one.
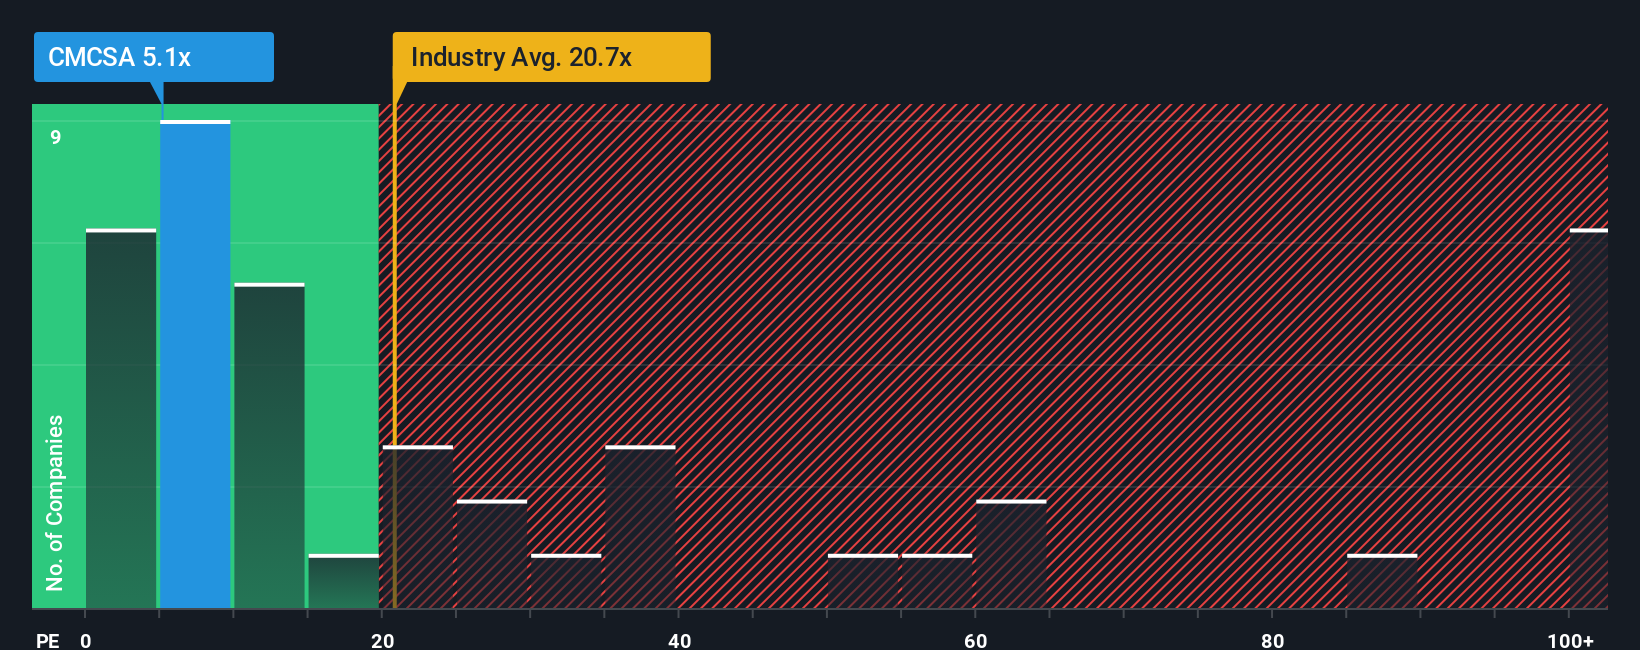
Comcast currently trades on a P/E of 4.53x. That sits below the Media industry average P/E of 14.18x and also below the peer group average of 20.80x. Simply Wall St then goes one step further with its Fair Ratio, which estimates what P/E might make sense given factors such as Comcast’s earnings profile, its industry, profit margins, market value and company specific risks. For Comcast, this Fair Ratio is 16.58x, which is designed to be more tailored than a simple comparison with broad industry or peer averages.
Compared with this Fair Ratio of 16.58x, Comcast’s actual P/E of 4.53x suggests the shares are trading below that model based benchmark.
Result: UNDERVALUED
P/E ratios tell one story, but what if the real opportunity lies elsewhere? Discover 1456 companies where insiders are betting big on explosive growth.
Upgrade Your Decision Making: Choose your Comcast Narrative
Earlier we mentioned that there is an even better way to understand valuation, so let us introduce you to Narratives, which let you attach your own story about Comcast’s future to concrete numbers like revenue, earnings, margins and a Fair Value that you can compare with today’s price.
A Narrative on Simply Wall St is a simple framework where you set out your view of Comcast, link it to a forecast, then see what Fair Value those assumptions imply, so you are always connecting the story in your head to the valuation on your screen.
These Narratives sit inside the Community page on Simply Wall St, are used by millions of investors, and update automatically when fresh news, earnings or estimates are added, so your Fair Value view is kept in sync with the latest information without you having to rebuild a model each time.
For Comcast right now, one investor might align with a lower Fair Value around US$28.00, while another might see upside closer to US$49.43. By comparing each Narrative’s Fair Value with the current share price, you can decide for yourself whether the stock looks closer to a buy, a hold, or a sell for your personal approach.
For Comcast, however, we will make it really easy for you with previews of two leading Comcast Narratives:
Fair value: US$34.65
Gap to this fair value: 18.8% below the narrative fair value at the recent US$28.13 share price
Revenue growth assumption: 1.53% per year
- Focuses on broadband upgrades, streaming scale at Peacock, and new parks like Epic Universe as key supports for earnings resilience and cash flow visibility.
- Builds in modest revenue growth with lower profit margins over time, and assumes the shares trade on a future P/E that is below the current US Media industry average.
- Anchors on an analyst consensus price target, while highlighting broadband competition, higher content costs, and media advertising pressure as important risks to watch.
Fair value: US$28.00
Gap to this fair value: 0.5% above the narrative fair value at the recent US$28.13 share price
Revenue growth assumption: 0.69% per year
- Emphasizes pressure on broadband and legacy media revenues from saturation, cord cutting, digital advertising shifts, and tougher content competition.
- Builds in declining margins alongside higher capital spending, which limits free cash flow and constrains room for shareholder returns.
- Frames US$28.00 as an anchor for a more cautious fair value view, with regulatory scrutiny, sports rights costs, and deal uncertainty as key longer term swing factors.
Those two Narratives bracket a fair value range that runs roughly from US$28.00 up to US$34.65, against the recent US$28.13 share price. Your own conclusion will come down to which story you think is closer to how Comcast’s broadband, media, and parks businesses actually play out, and what risks you are comfortable taking on at today’s price.
Curious how numbers become stories that shape markets? Explore Community Narratives
Do you think there's more to the story for Comcast? Head over to our Community to see what others are saying!

This article by Simply Wall St is general in nature. We provide commentary based on historical data and analyst forecasts only using an unbiased methodology and our articles are not intended to be financial advice. It does not constitute a recommendation to buy or sell any stock, and does not take account of your objectives, or your financial situation. We aim to bring you long-term focused analysis driven by fundamental data. Note that our analysis may not factor in the latest price-sensitive company announcements or qualitative material. Simply Wall St has no position in any stocks mentioned.
Have feedback on this article? Concerned about the content? Get in touch with us directly. Alternatively, email editorial-team@simplywallst.com