
- LIVE QUOTES
- LEARN
- HELP
 Nasdaq
 Wall Street Journal
EN
Assessing Coinbase Global (COIN) After Recent Crypto Swings And A Mixed Valuation Picture
- If you are trying to work out whether Coinbase Global's share price still makes sense after recent crypto swings, the key question is how its current market value compares with what the underlying business might justify.
- The stock last closed at US$254.92, with a 10.1% return over the past week, a 5.5% decline over the past month and a 7.8% gain year to date, while the 1 year return sits at a 3.6% decline and the 3 year return is very large.
- Recent price moves have come alongside ongoing attention on cryptocurrencies and listed exchanges, as investors continue to assess the role of regulated platforms in the broader digital asset space. Coinbase often trades as a high profile way for stock market investors to express a view on crypto related activity, which can feed into short term swings in sentiment.
- On our checks, Coinbase Global scores a 3 out of 6 valuation score. We will look at what different valuation approaches say about that number, and then finish with a way to think about value that goes beyond any single model.
Find out why Coinbase Global's -3.6% return over the last year is lagging behind its peers.
Approach 1: Coinbase Global Excess Returns Analysis
The Excess Returns model looks at how efficiently Coinbase Global turns shareholder capital into profits, and then asks how much of those profits are above the return that investors typically require.
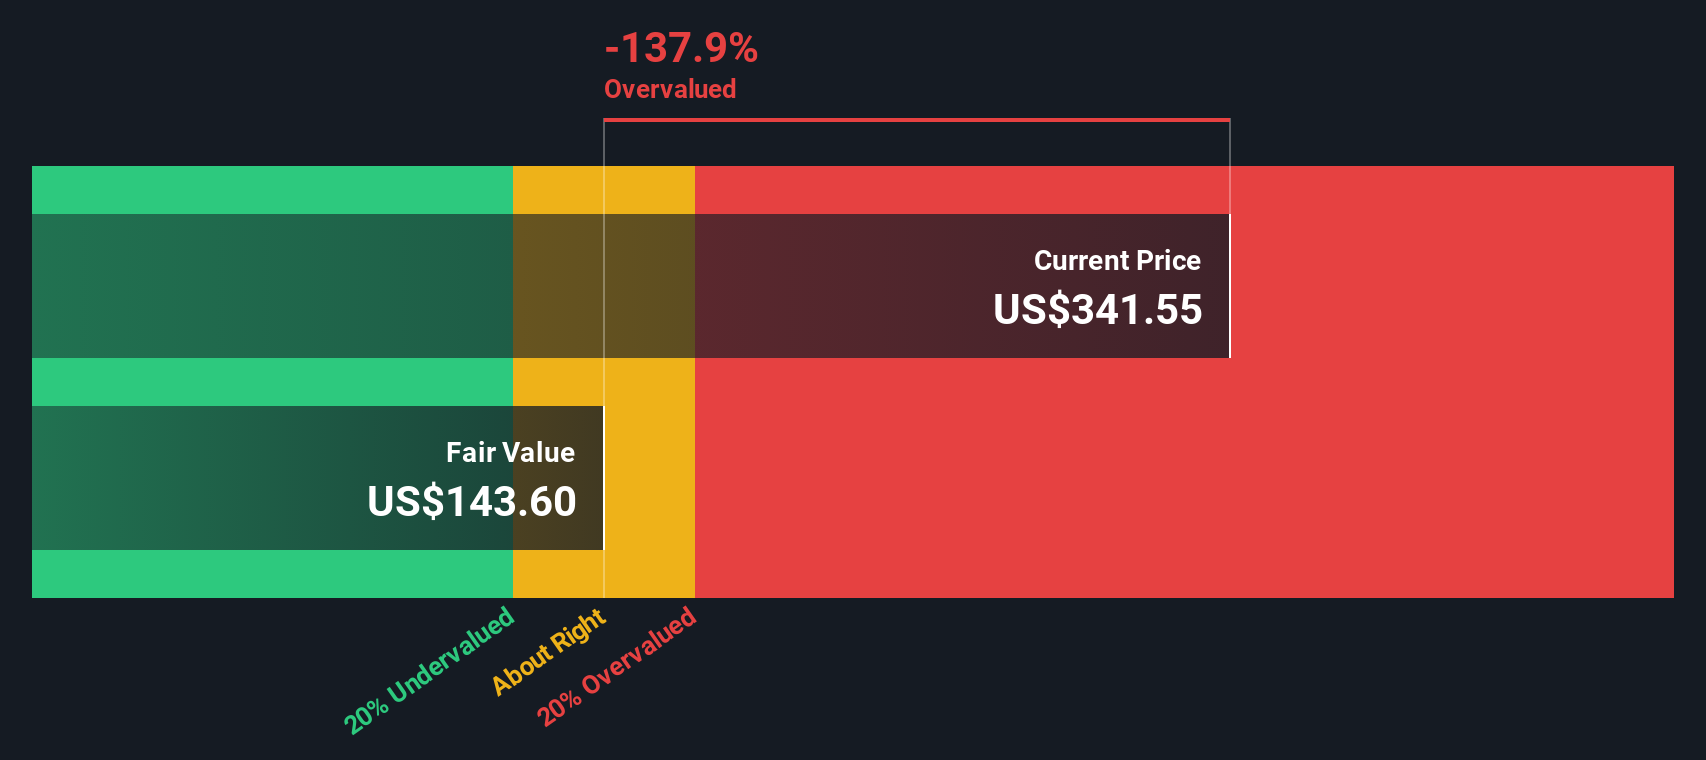
Here, the starting point is book value of $59.62 per share and a stable earnings per share estimate of $7.41, based on weighted future Return on Equity inputs from 7 analysts. The average Return on Equity used in the model is 13.28%, compared with a cost of equity of $4.67 per share. That gap creates an estimated excess return of $2.74 per share. This is then projected forward using a stable book value assumption of $55.83 per share, sourced from 2 analysts.
When those excess returns are capitalised, the model produces an intrinsic value of about $109.58 per share. Compared with the recent share price of $254.92, this implies Coinbase Global is 132.6% overvalued on this framework. In other words, the model is sending a clear caution signal at current levels.
Result: OVERVALUED
Our Excess Returns analysis suggests Coinbase Global may be overvalued by 132.6%. Discover 878 undervalued stocks or create your own screener to find better value opportunities.
Approach 2: Coinbase Global Price vs Earnings
For profitable companies, the P/E ratio is a helpful way to link what you pay for each share with the earnings the business is currently generating. It gives you a quick sense of how many dollars investors are willing to pay today for one dollar of current earnings.
What counts as a “normal” or “fair” P/E depends on how fast earnings are expected to grow and how risky those earnings are perceived to be. Higher expected growth or lower perceived risk can support a higher P/E, while slower growth or higher risk usually calls for a lower one.
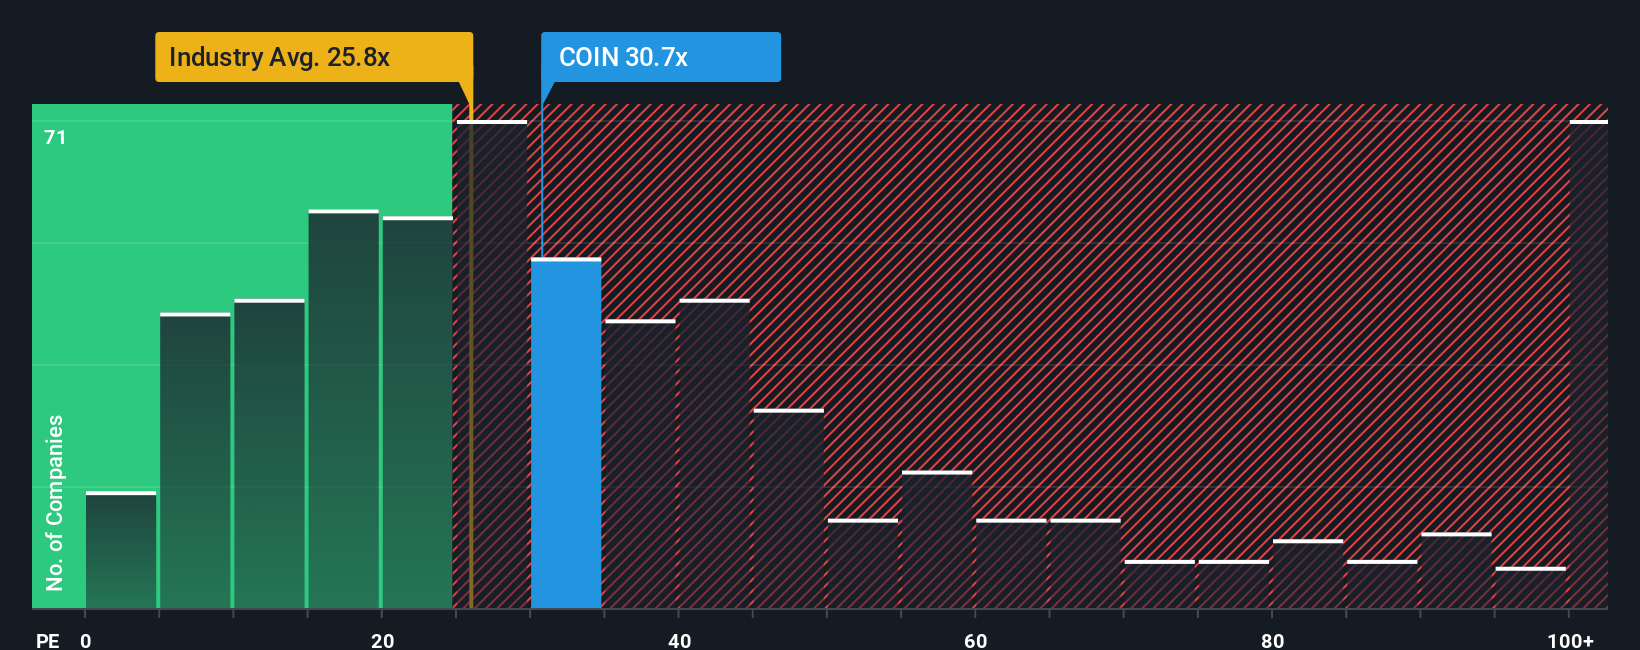
Coinbase Global currently trades on a P/E of 21.36x. That sits below the Capital Markets industry average P/E of 25.75x and below the peer average of 35.46x. Simply Wall St’s Fair Ratio for Coinbase Global is 21.93x. This Fair Ratio is a proprietary estimate of what the P/E “should” be, given factors such as earnings growth, profit margins, risk profile, market cap and the company’s industry. It can therefore be more tailored than a simple comparison with peers or the broad industry.
Comparing Coinbase Global’s actual P/E of 21.36x with the Fair Ratio of 21.93x suggests the stock is about right on this metric.
Result: ABOUT RIGHT
P/E ratios tell one story, but what if the real opportunity lies elsewhere? Discover 1456 companies where insiders are betting big on explosive growth.
Upgrade Your Decision Making: Choose your Coinbase Global Narrative
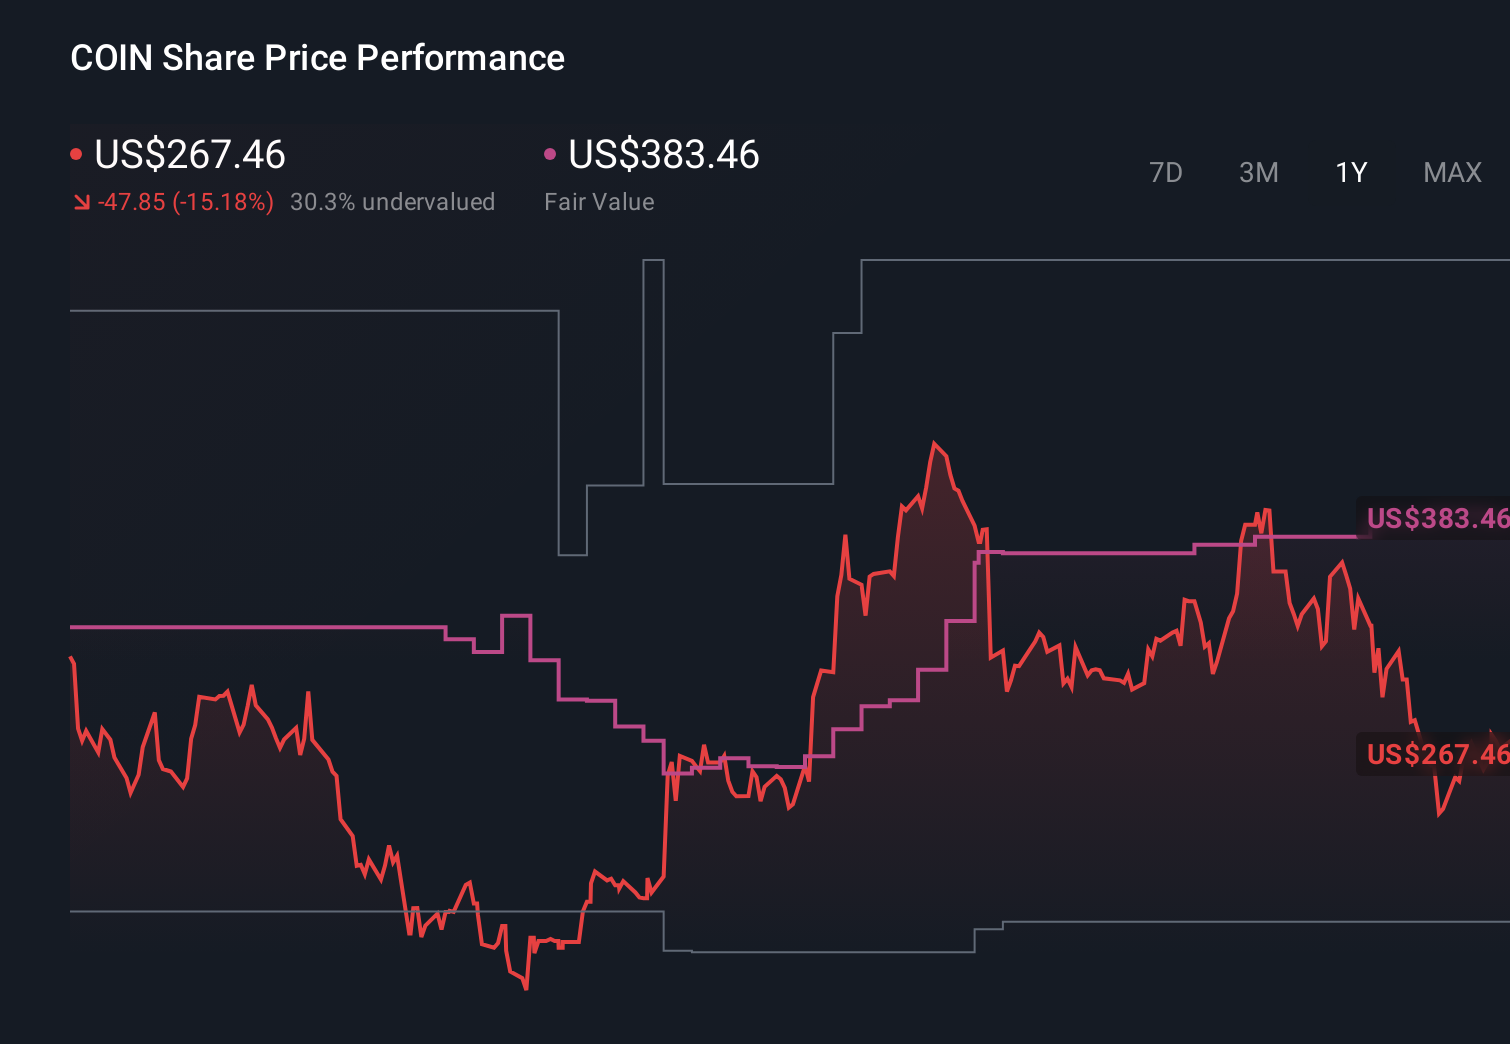
Earlier we mentioned that there is an even better way to understand valuation. Let us introduce you to Narratives, which are simply the story you believe about a company linked directly to your own forecast for its future revenue, earnings and margins. This then connects to a Fair Value that you can easily compare with the current share price on Simply Wall St’s Community page, where Narratives are updated automatically when new information such as earnings or news releases arrive. For Coinbase Global, that might mean one investor builds a bullish Narrative around the higher fair value of about $383.46 with assumptions similar to the more optimistic analyst targets. Another investor might build a more cautious Narrative closer to $185. By setting out these different stories and numbers side by side, Narratives help you decide whether the current price looks attractive, rich or somewhere in between based on your own view rather than a single model or someone else’s opinion.
Do you think there's more to the story for Coinbase Global? Head over to our Community to see what others are saying!
This article by Simply Wall St is general in nature. We provide commentary based on historical data and analyst forecasts only using an unbiased methodology and our articles are not intended to be financial advice. It does not constitute a recommendation to buy or sell any stock, and does not take account of your objectives, or your financial situation. We aim to bring you long-term focused analysis driven by fundamental data. Note that our analysis may not factor in the latest price-sensitive company announcements or qualitative material. Simply Wall St has no position in any stocks mentioned.
Have feedback on this article? Concerned about the content? Get in touch with us directly. Alternatively, email editorial-team@simplywallst.com