
- LIVE QUOTES
- LEARN
- HELP
 Nasdaq
 Wall Street Journal
EN
Is Metro (TSX:MRU) Pricing Look Attractive After Recent Multi‑Year Share Gains
- If you are wondering whether Metro's current share price lines up with its underlying value, you are not alone. This article is built to help you assess that question clearly.
- Metro shares last closed at C$98.68, with returns of 0.0% over 7 days, a 1.2% decline over 30 days, a 0.3% decline year to date, and gains of 11.6% over 1 year, 39.8% over 3 years, and 84.4% over 5 years. These figures can shape how investors think about both opportunity and risk today.
- Recent coverage of Metro has focused on its position as a Canadian consumer retail stock and how investors are assessing its long term prospects relative to peers and the wider market. This context is useful when thinking about whether the share price reflects expectations for the business or if sentiment has moved ahead of, or behind, the fundamentals.
- Metro currently has a valuation score of 3 out of 6. We will look at how standard methods like P/E, cash flow based models, and peer comparisons line up, before finishing with a more complete way to think about valuation that ties these pieces together.
Find out why Metro's 11.6% return over the last year is lagging behind its peers.
Approach 1: Metro Discounted Cash Flow (DCF) Analysis
A Discounted Cash Flow, or DCF, model projects a company’s future cash flows and then discounts those projections back to today’s value to estimate what the business could be worth per share.
For Metro, the model uses last twelve months Free Cash Flow of about CA$1.13b and applies a 2 Stage Free Cash Flow to Equity approach. Analysts provide estimates for the next few years, and Simply Wall St extends these out to a 10 year path, with projected Free Cash Flow in 2035 of about CA$1.16b. Each of these future cash flows is discounted back to today using a required rate of return.
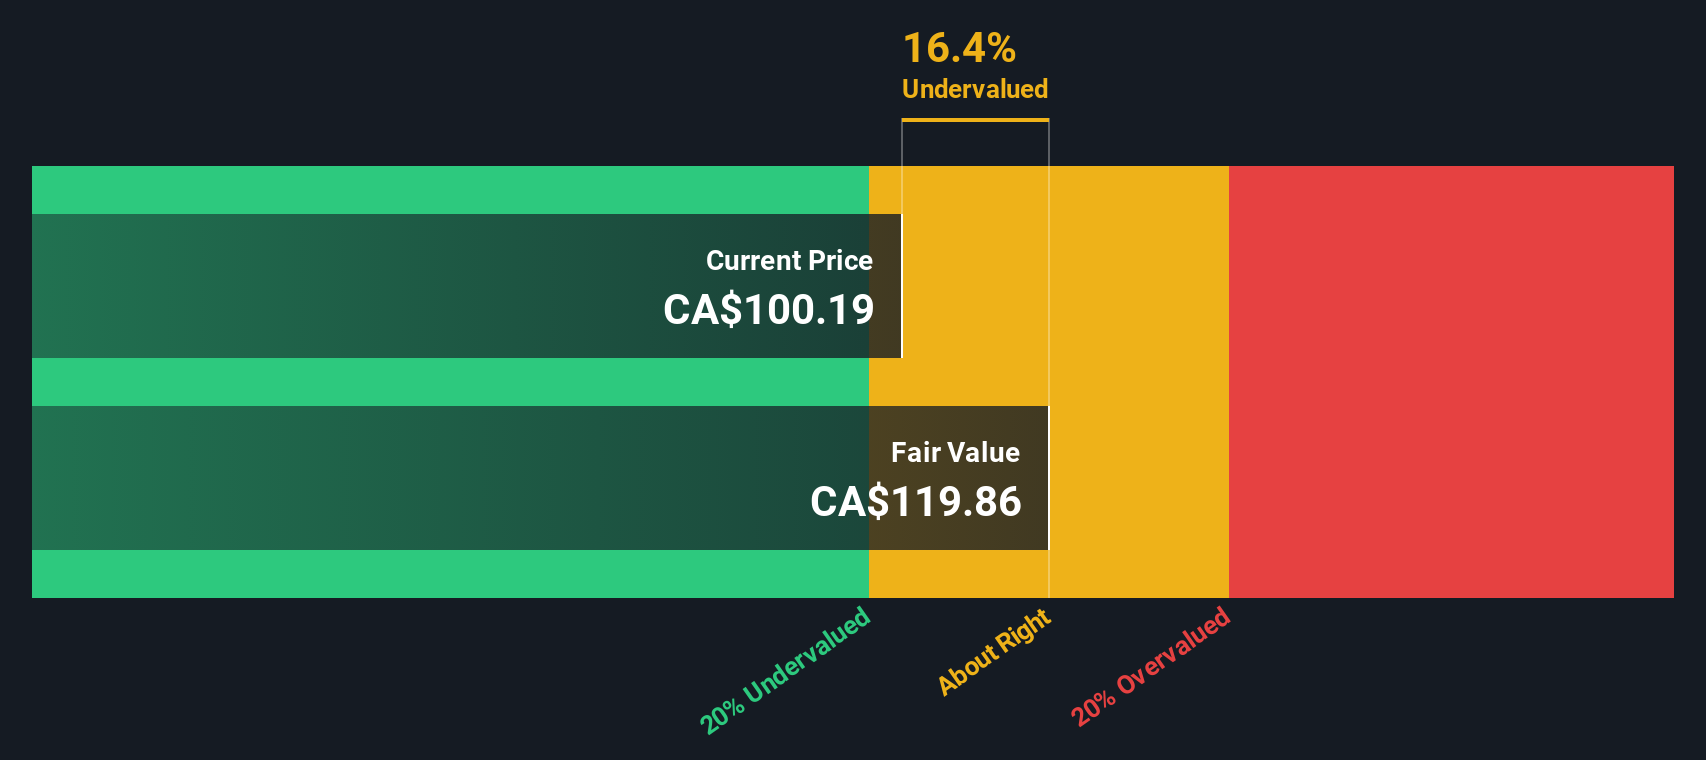
On this basis, the DCF model arrives at an estimated intrinsic value of CA$118.83 per share, compared with the recent market price of CA$98.68. That indicates the shares trade at about a 17.0% discount to this cash flow based estimate, and the market price is below what the model indicates.
Result: UNDERVALUED
Our Discounted Cash Flow (DCF) analysis suggests Metro is undervalued by 17.0%. Track this in your watchlist or portfolio, or discover 878 more undervalued stocks based on cash flows.
Approach 2: Metro Price vs Earnings
For a profitable company like Metro, the P/E ratio is a helpful way to see what investors are currently paying for each dollar of earnings. A higher or lower P/E often reflects what the market expects for future growth and how much risk investors are willing to accept, so a “normal” or “fair” P/E will vary by company and industry.
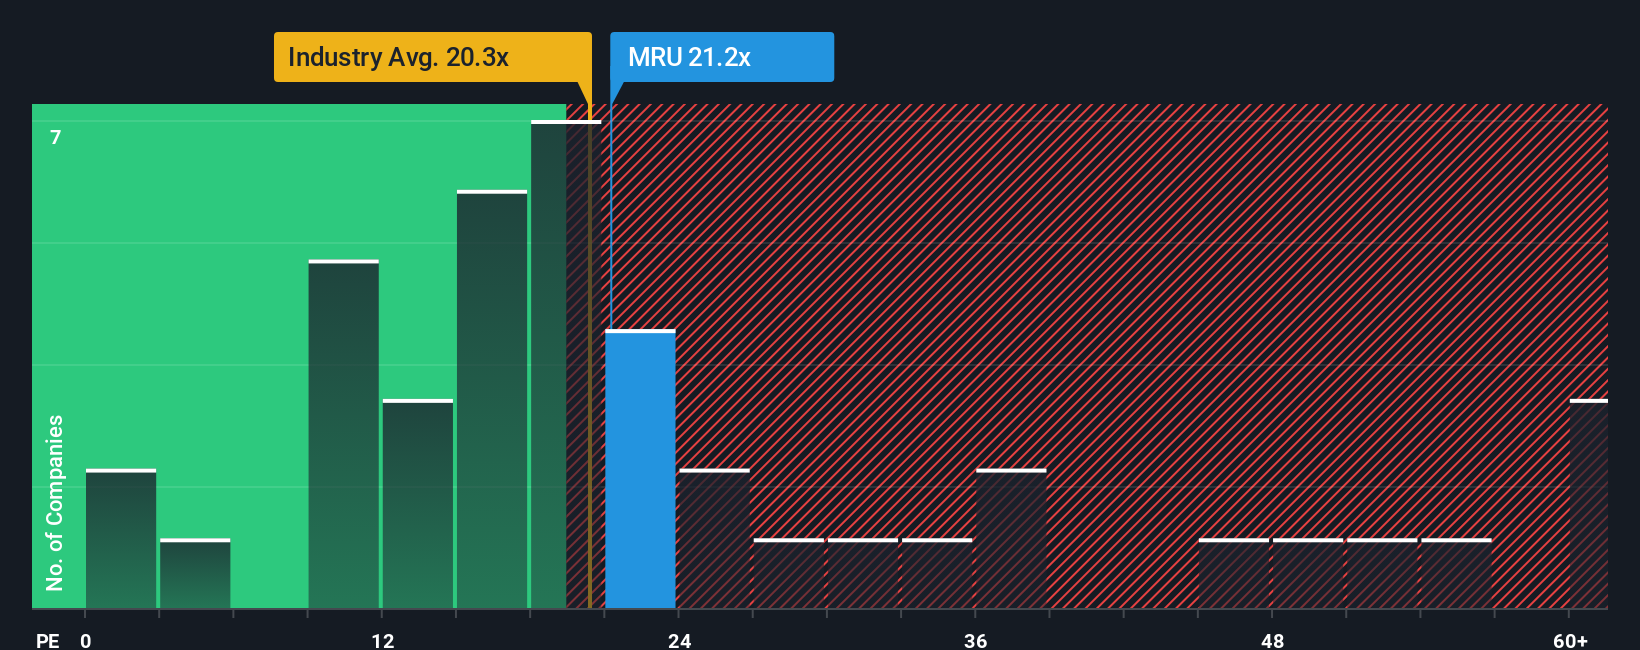
Metro trades on a P/E of 20.75x. That sits above the Consumer Retailing industry average of 17.75x, and slightly below the peer group average of 22.08x. These simple comparisons tell you how the market is pricing Metro relative to other retailers, but they do not fully account for the company’s specific growth outlook, profitability, size and risk profile.
Simply Wall St’s Fair Ratio aims to fill that gap. It is a proprietary P/E estimate that reflects factors such as earnings growth, profit margins, industry, market cap and identified risks. For Metro, the Fair Ratio is 19.85x, which is modestly below the current 20.75x. That points to the shares trading a little above what this model suggests might be reasonable, although the difference is not extreme.
Result: OVERVALUED
P/E ratios tell one story, but what if the real opportunity lies elsewhere? Discover 1457 companies where insiders are betting big on explosive growth.
Upgrade Your Decision Making: Choose your Metro Narrative
Earlier we mentioned that there is an even better way to understand valuation, so let us introduce you to Narratives. This is a simple tool on Simply Wall St’s Community page where you connect your story about Metro, including your assumptions for future revenue, earnings, margins and a fair value, to the current share price. This allows you to see if your view points you toward buying, holding or selling. The platform keeps your Narrative updated when new news or earnings arrive. For example, one investor might build a Narrative around a fair value of CA$118.0 based on confidence in store modernization, e-commerce growth and supply chain automation, while another anchors on CA$80.0 because they are more focused on competition, margin pressure and geographic concentration.
Do you think there's more to the story for Metro? Head over to our Community to see what others are saying!

This article by Simply Wall St is general in nature. We provide commentary based on historical data and analyst forecasts only using an unbiased methodology and our articles are not intended to be financial advice. It does not constitute a recommendation to buy or sell any stock, and does not take account of your objectives, or your financial situation. We aim to bring you long-term focused analysis driven by fundamental data. Note that our analysis may not factor in the latest price-sensitive company announcements or qualitative material. Simply Wall St has no position in any stocks mentioned.
Have feedback on this article? Concerned about the content? Get in touch with us directly. Alternatively, email editorial-team@simplywallst.com