
- LIVE QUOTES
- LEARN
- HELP
 Nasdaq
 Wall Street Journal
EN
Is Sensata Technologies Holding (ST) Attractively Priced After Recent Share Price Rebound?
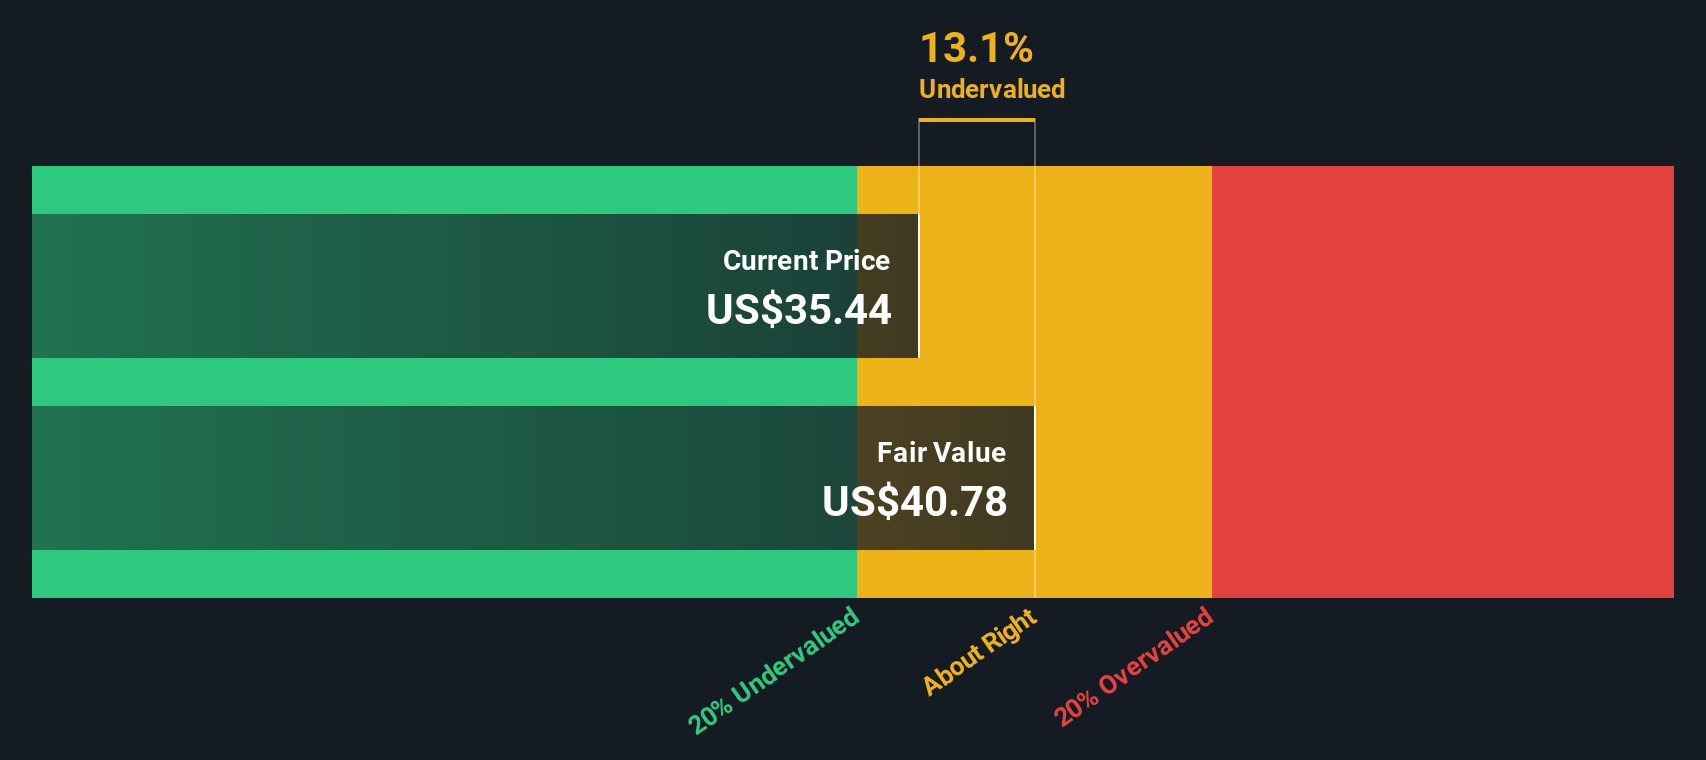
- If you are wondering whether Sensata Technologies Holding is offering fair value at its current price, this breakdown is designed to give you a clear, numbers first view of the stock.
- The share price closed at US$35.21 recently, with returns of 6.6% over the last 7 days, 4.9% over 30 days, 0.9% year to date and 26.0% over the past year. The 3 year and 5 year returns stand at a 16.8% decline and 34.4% decline respectively.
- These mixed returns over different time frames suggest that investors have been reassessing both the risks and potential of Sensata Technologies Holding, with shorter term gains sitting alongside weaker longer term performance. This context makes it especially useful to step back and look at what the underlying valuation signals are saying right now.
- On our simple valuation checklist, Sensata Technologies Holding scores a 4 out of 6, which means it screens as undervalued on four of six checks. Next we will look at how different valuation approaches arrive at that score, and then finish with a way to frame valuation that can be even more useful than any single model.
Approach 1: Sensata Technologies Holding Discounted Cash Flow (DCF) Analysis
A Discounted Cash Flow, or DCF, model takes estimates of the cash a company could generate in the future and discounts those amounts back to today using a required return, to arrive at an estimate of what the business might be worth right now.
For Sensata Technologies Holding, the model used is a 2 Stage Free Cash Flow to Equity approach, based on cash flow projections. The latest twelve month free cash flow is about $433.1 million. Analysts provide estimates for the next few years, and Simply Wall St then extrapolates further. By 2029, projected free cash flow is $583.5 million, with discounted values provided through to 2035.
Bringing all of those projected cash flows back to today, the DCF output suggests an estimated intrinsic value of about $40.91 per share. Against the recent share price of US$35.21, that implies the stock screens as 13.9% undervalued on this model.
Result: UNDERVALUED
Our Discounted Cash Flow (DCF) analysis suggests Sensata Technologies Holding is undervalued by 13.9%. Track this in your watchlist or portfolio, or discover 877 more undervalued stocks based on cash flows.
Approach 2: Sensata Technologies Holding Price vs Sales
For companies where earnings can be noisy or even negative, the P/S ratio is often a useful way to compare what investors are paying for each dollar of revenue. It keeps the focus on the top line, which tends to be more stable than earnings in many cases.
What counts as a “normal” multiple is usually shaped by how quickly revenue is expected to grow and how risky that growth is. Higher growth and lower perceived risk can justify a higher P/S multiple, while slower growth or higher uncertainty usually points to a lower one.
Sensata Technologies Holding currently trades at a P/S of 1.39x. That sits below the Electrical industry average of 2.17x and also below the peer group average of 4.72x. Simply Wall St’s Fair Ratio for Sensata, which is 1.53x, goes a step further. This proprietary metric estimates the P/S that might be reasonable after factoring in elements like earnings growth, profit margins, industry, company size and company specific risks.
Because the Fair Ratio blends these company specific drivers, it can be more tailored than a simple comparison with peers or the wider industry. With the current P/S of 1.39x versus a Fair Ratio of 1.53x, Sensata appears undervalued on this measure.
Result: UNDERVALUED

P/S ratios tell one story, but what if the real opportunity lies elsewhere? Discover 1459 companies where insiders are betting big on explosive growth.
Upgrade Your Decision Making: Choose your Sensata Technologies Holding Narrative
Earlier we mentioned that there is an even better way to understand valuation. On Simply Wall St’s Community page you can use Narratives to attach your own story about Sensata Technologies Holding to the numbers. This lets you link your view of its future revenue, earnings and margins to a forecast and fair value, then compare that fair value with the current price to decide whether it looks attractive to you. The tool keeps updating your Narrative as new earnings, guidance or news arrive. One investor might build a confident growth Narrative closer to the US$51 upper analyst target, while another might set a more cautious Narrative around the US$30 lower target. All of this is available within the same easy framework that is already used by millions of investors.
Do you think there's more to the story for Sensata Technologies Holding? Head over to our Community to see what others are saying!

This article by Simply Wall St is general in nature. We provide commentary based on historical data and analyst forecasts only using an unbiased methodology and our articles are not intended to be financial advice. It does not constitute a recommendation to buy or sell any stock, and does not take account of your objectives, or your financial situation. We aim to bring you long-term focused analysis driven by fundamental data. Note that our analysis may not factor in the latest price-sensitive company announcements or qualitative material. Simply Wall St has no position in any stocks mentioned.
Have feedback on this article? Concerned about the content? Get in touch with us directly. Alternatively, email editorial-team@simplywallst.com