
- LIVE QUOTES
- LEARN
- HELP
 Nasdaq
 Wall Street Journal
EN
Jindal Saw Limited's (NSE:JINDALSAW) biggest owners are private companies who got richer after stock soared 4.5% last week
Key Insights
- Significant control over Jindal Saw by private companies implies that the general public has more power to influence management and governance-related decisions
- The top 4 shareholders own 52% of the company
- Using data from company's past performance alongside ownership research, one can better assess the future performance of a company
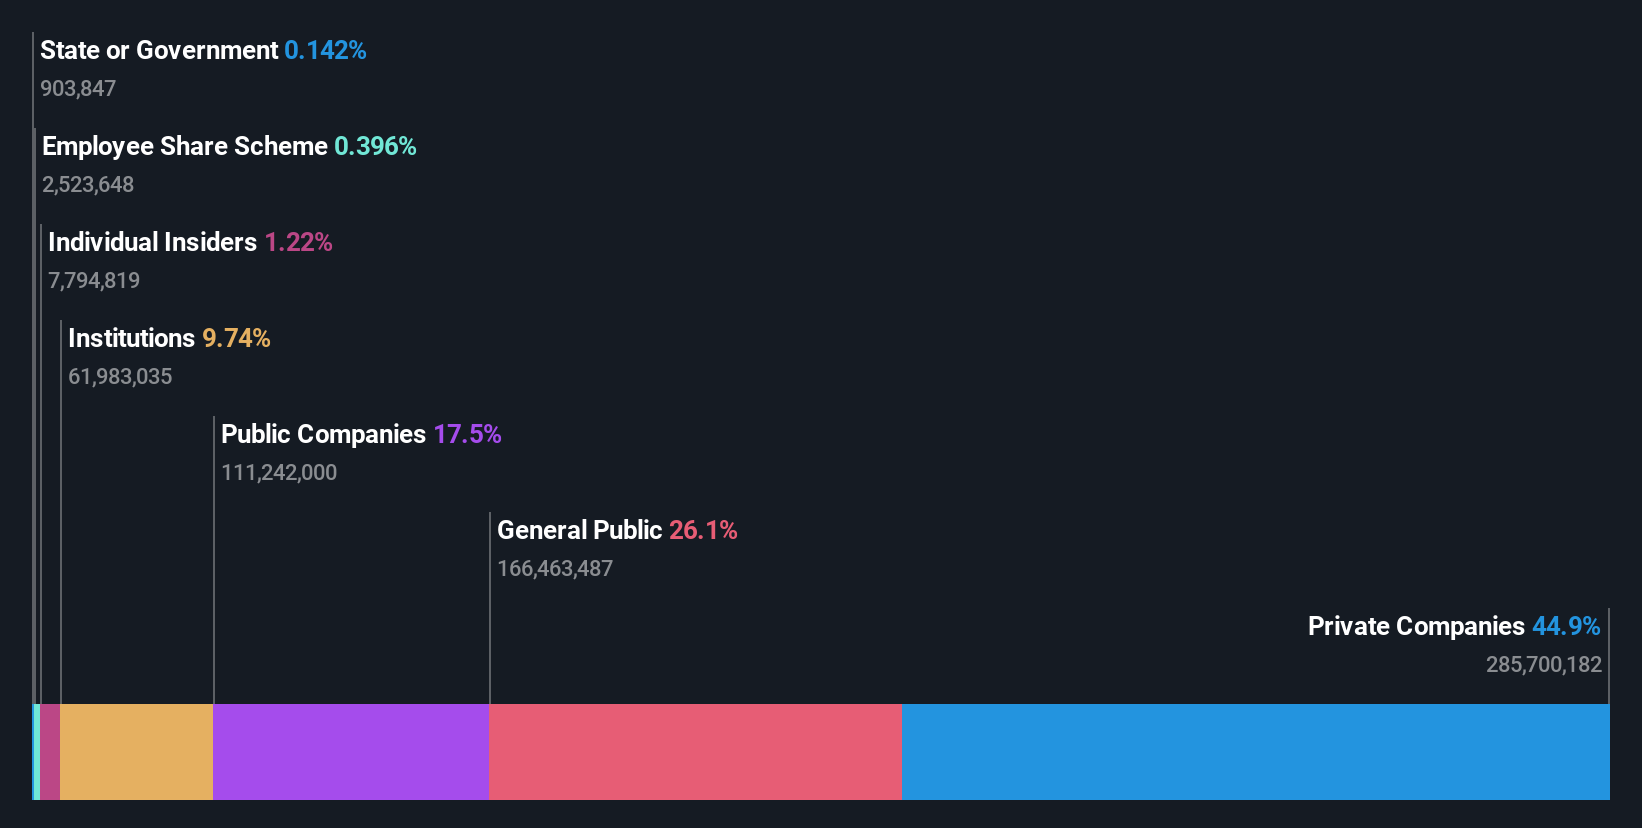
To get a sense of who is truly in control of Jindal Saw Limited (NSE:JINDALSAW), it is important to understand the ownership structure of the business. With 45% stake, private companies possess the maximum shares in the company. That is, the group stands to benefit the most if the stock rises (or lose the most if there is a downturn).
As a result, private companies were the biggest beneficiaries of last week’s 4.5% gain.
In the chart below, we zoom in on the different ownership groups of Jindal Saw.
See our latest analysis for Jindal Saw
What Does The Institutional Ownership Tell Us About Jindal Saw?
Institutional investors commonly compare their own returns to the returns of a commonly followed index. So they generally do consider buying larger companies that are included in the relevant benchmark index.
Jindal Saw already has institutions on the share registry. Indeed, they own a respectable stake in the company. This suggests some credibility amongst professional investors. But we can't rely on that fact alone since institutions make bad investments sometimes, just like everyone does. When multiple institutions own a stock, there's always a risk that they are in a 'crowded trade'. When such a trade goes wrong, multiple parties may compete to sell stock fast. This risk is higher in a company without a history of growth. You can see Jindal Saw's historic earnings and revenue below, but keep in mind there's always more to the story.

Hedge funds don't have many shares in Jindal Saw. Nalwa Sons Investments Limited is currently the largest shareholder, with 17% of shares outstanding. Green Lamina Investment Limited is the second largest shareholder owning 14% of common stock, and PRJ Family Management Company Private Limited holds about 12% of the company stock.
On looking further, we found that 52% of the shares are owned by the top 4 shareholders. In other words, these shareholders have a meaningful say in the decisions of the company.
While studying institutional ownership for a company can add value to your research, it is also a good practice to research analyst recommendations to get a deeper understand of a stock's expected performance. There is a little analyst coverage of the stock, but not much. So there is room for it to gain more coverage.
Insider Ownership Of Jindal Saw
The definition of company insiders can be subjective and does vary between jurisdictions. Our data reflects individual insiders, capturing board members at the very least. Company management run the business, but the CEO will answer to the board, even if he or she is a member of it.
I generally consider insider ownership to be a good thing. However, on some occasions it makes it more difficult for other shareholders to hold the board accountable for decisions.
We can report that insiders do own shares in Jindal Saw Limited. This is a big company, so it is good to see this level of alignment. Insiders own ₹1.3b worth of shares (at current prices). It is good to see this level of investment by insiders. You can check here to see if those insiders have been buying recently.
General Public Ownership
The general public, who are usually individual investors, hold a 26% stake in Jindal Saw. This size of ownership, while considerable, may not be enough to change company policy if the decision is not in sync with other large shareholders.
Private Company Ownership
Our data indicates that Private Companies hold 45%, of the company's shares. Private companies may be related parties. Sometimes insiders have an interest in a public company through a holding in a private company, rather than in their own capacity as an individual. While it's hard to draw any broad stroke conclusions, it is worth noting as an area for further research.
Public Company Ownership
It appears to us that public companies own 17% of Jindal Saw. We can't be certain but it is quite possible this is a strategic stake. The businesses may be similar, or work together.
Next Steps:
It's always worth thinking about the different groups who own shares in a company. But to understand Jindal Saw better, we need to consider many other factors. To that end, you should learn about the 2 warning signs we've spotted with Jindal Saw (including 1 which can't be ignored) .
If you would prefer discover what analysts are predicting in terms of future growth, do not miss this free report on analyst forecasts.
NB: Figures in this article are calculated using data from the last twelve months, which refer to the 12-month period ending on the last date of the month the financial statement is dated. This may not be consistent with full year annual report figures.
Have feedback on this article? Concerned about the content? Get in touch with us directly. Alternatively, email editorial-team (at) simplywallst.com.
This article by Simply Wall St is general in nature. We provide commentary based on historical data and analyst forecasts only using an unbiased methodology and our articles are not intended to be financial advice. It does not constitute a recommendation to buy or sell any stock, and does not take account of your objectives, or your financial situation. We aim to bring you long-term focused analysis driven by fundamental data. Note that our analysis may not factor in the latest price-sensitive company announcements or qualitative material. Simply Wall St has no position in any stocks mentioned.