
- LIVE QUOTES
- LEARN
- HELP
 Nasdaq
 Wall Street Journal
EN
Hino Motors (TSE:7205) Valuation Check After Recent Share Price Recovery
Stock move and recent performance
Hino Motors (TSE:7205) has drawn fresh attention after a recent 3.1% daily gain, adding to its modest share price rise over the past month, while longer term returns remain negative for many holders.
See our latest analysis for Hino Motors.
The 3.1% one-day share price return at ¥398 comes on top of a 7.3% 30-day share price gain. However, the one-year total shareholder return of about a 27% decline suggests that longer-term momentum has been weak rather than building.
If you are comparing Hino with other commercial vehicle makers, this could be a good moment to scan auto manufacturers for alternatives in the same space.
So with Hino trading at ¥398, carrying an intrinsic value estimate that sits materially higher and a mixed track record of shareholder returns, is this a reset level that offers upside or is the market already pricing in future growth?
Price-to-Earnings of 9.4x: Is it justified?
On a P/E of 9.4x at a last close of ¥398, Hino Motors screens as undervalued compared with peers that trade on higher earnings multiples and with its own fair ratio.
The P/E multiple compares the current share price to earnings per share. For a commercial vehicle manufacturer like Hino it reflects what the market is willing to pay for each unit of current earnings.
Hino is described as trading at good value versus both peers and the wider Machinery industry, where average P/E levels of 13.1x for peers and 12.7x for the industry sit meaningfully above its 9.4x. Against an estimated fair P/E of 21.8x, the current valuation looks even more compressed, suggesting substantial room for the earnings multiple to move closer to that fair ratio if sentiment or fundamentals support it.
Explore the SWS fair ratio for Hino Motors
Result: Price-to-Earnings of 9.4x (UNDERVALUED)
However, you still need to weigh risks such as the 27% one-year total return decline and the 56.5% five-year total return decline before leaning on the valuation story.
Find out about the key risks to this Hino Motors narrative.
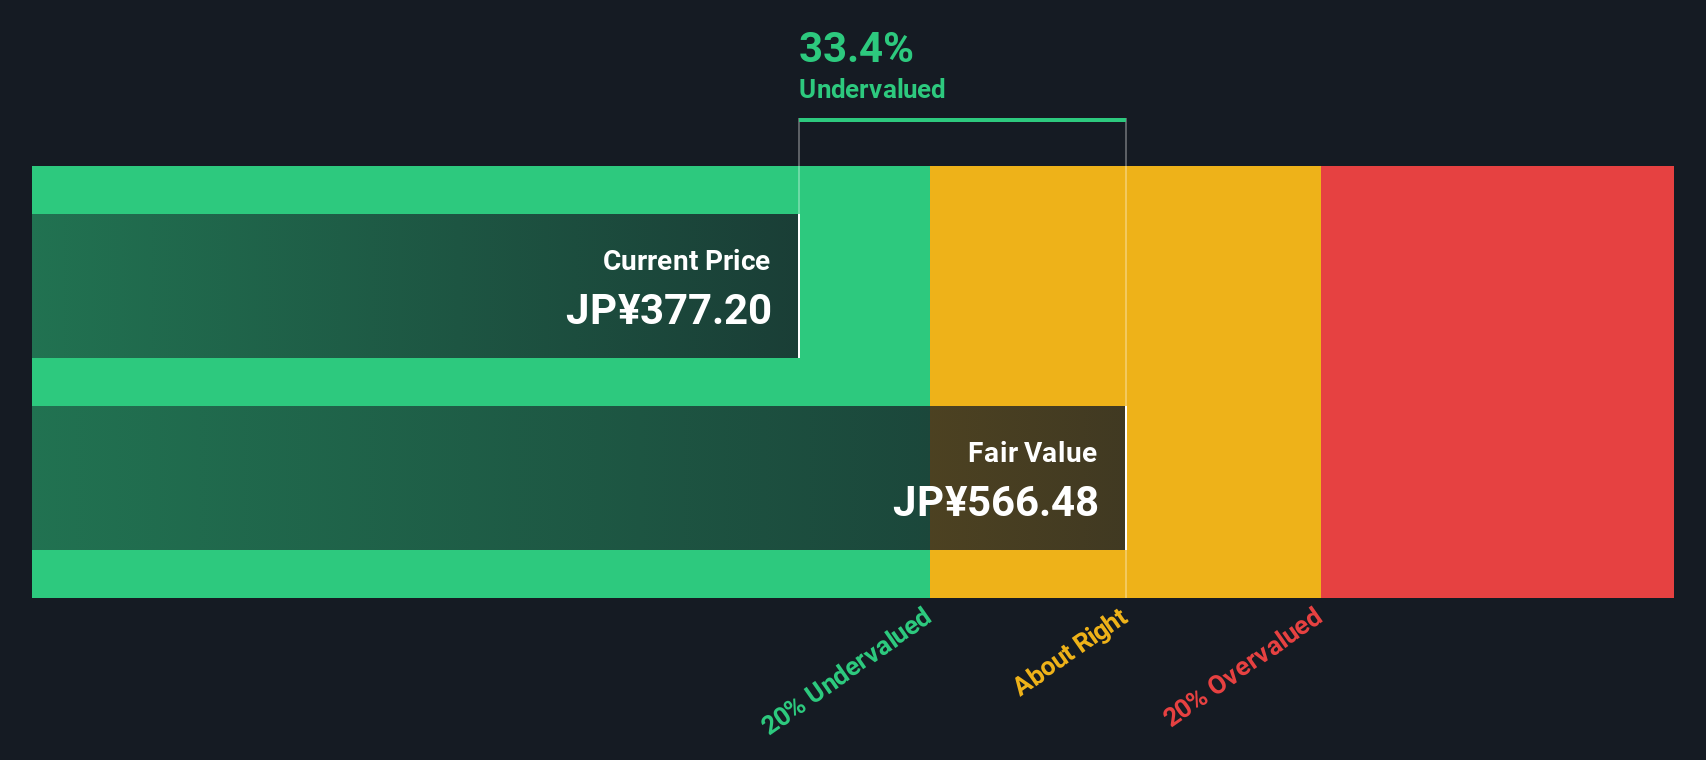
Another view using our DCF model
The P/E points to value, but our DCF model goes further. On this approach, Hino Motors at ¥398 sits about 39% below an estimated fair value of roughly ¥654, which also signals undervaluation. The question is whether the cash flows that underpin that gap will actually materialise.
Look into how the SWS DCF model arrives at its fair value.
Simply Wall St performs a discounted cash flow (DCF) on every stock in the world every day (check out Hino Motors for example). We show the entire calculation in full. You can track the result in your watchlist or portfolio and be alerted when this changes, or use our stock screener to discover 876 undervalued stocks based on their cash flows. If you save a screener we even alert you when new companies match - so you never miss a potential opportunity.
Build Your Own Hino Motors Narrative
If you look at this and feel differently, or simply want to test your own view using the same data, you can build a personalised take in just a few minutes: Do it your way
A great starting point for your Hino Motors research is our analysis highlighting 4 key rewards and 1 important warning sign that could impact your investment decision.
Looking for more investment ideas?
If Hino has sparked your interest, do not stop here. Use the same tools to spot other potential opportunities before they move without you.
- Target potential value candidates by scanning these 876 undervalued stocks based on cash flows that currently trade at a discount to what their cash flows suggest they could be worth.
- Tap into growth themes by tracking these 25 AI penny stocks that are tied to artificial intelligence trends across sectors.
- Strengthen your income focus by reviewing these 14 dividend stocks with yields > 3% that may offer higher yields than holding cash alone.
This article by Simply Wall St is general in nature. We provide commentary based on historical data and analyst forecasts only using an unbiased methodology and our articles are not intended to be financial advice. It does not constitute a recommendation to buy or sell any stock, and does not take account of your objectives, or your financial situation. We aim to bring you long-term focused analysis driven by fundamental data. Note that our analysis may not factor in the latest price-sensitive company announcements or qualitative material. Simply Wall St has no position in any stocks mentioned.
Have feedback on this article? Concerned about the content? Get in touch with us directly. Alternatively, email editorial-team@simplywallst.com