
- LIVE QUOTES
- LEARN
- HELP
 Nasdaq
 Wall Street Journal
EN
Returns Are Gaining Momentum At Mizuno (TSE:8022)
If you're looking for a multi-bagger, there's a few things to keep an eye out for. One common approach is to try and find a company with returns on capital employed (ROCE) that are increasing, in conjunction with a growing amount of capital employed. Put simply, these types of businesses are compounding machines, meaning they are continually reinvesting their earnings at ever-higher rates of return. So on that note, Mizuno (TSE:8022) looks quite promising in regards to its trends of return on capital.
What Is Return On Capital Employed (ROCE)?
Just to clarify if you're unsure, ROCE is a metric for evaluating how much pre-tax income (in percentage terms) a company earns on the capital invested in its business. To calculate this metric for Mizuno, this is the formula:
Return on Capital Employed = Earnings Before Interest and Tax (EBIT) ÷ (Total Assets - Current Liabilities)
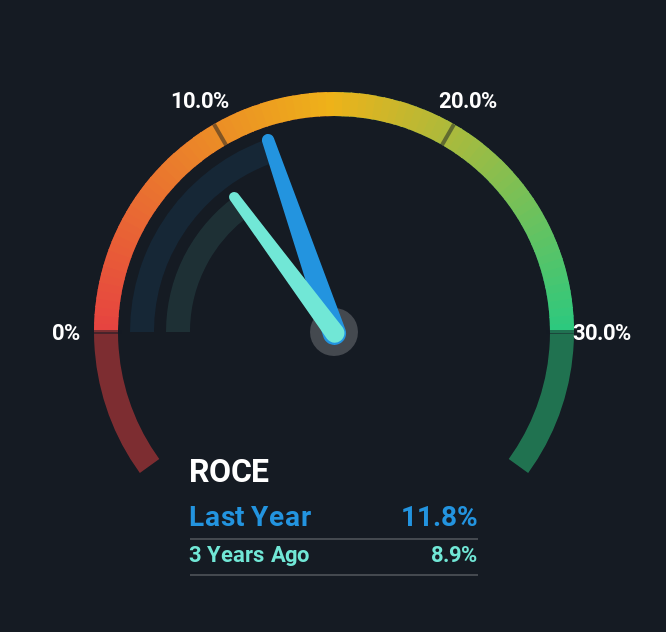
0.12 = JP¥22b ÷ (JP¥221b - JP¥39b) (Based on the trailing twelve months to September 2025).
So, Mizuno has an ROCE of 12%. By itself that's a normal return on capital and it's in line with the industry's average returns of 12%.
See our latest analysis for Mizuno
In the above chart we have measured Mizuno's prior ROCE against its prior performance, but the future is arguably more important. If you'd like, you can check out the forecasts from the analysts covering Mizuno for free.
So How Is Mizuno's ROCE Trending?
Mizuno is displaying some positive trends. The data shows that returns on capital have increased substantially over the last five years to 12%. The company is effectively making more money per dollar of capital used, and it's worth noting that the amount of capital has increased too, by 61%. This can indicate that there's plenty of opportunities to invest capital internally and at ever higher rates, a combination that's common among multi-baggers.
The Bottom Line
In summary, it's great to see that Mizuno can compound returns by consistently reinvesting capital at increasing rates of return, because these are some of the key ingredients of those highly sought after multi-baggers. Since the stock has returned a staggering 420% to shareholders over the last five years, it looks like investors are recognizing these changes. Therefore, we think it would be worth your time to check if these trends are going to continue.
Before jumping to any conclusions though, we need to know what value we're getting for the current share price. That's where you can check out our FREE intrinsic value estimation for 8022 that compares the share price and estimated value.
If you want to search for solid companies with great earnings, check out this free list of companies with good balance sheets and impressive returns on equity.
Have feedback on this article? Concerned about the content? Get in touch with us directly. Alternatively, email editorial-team (at) simplywallst.com.
This article by Simply Wall St is general in nature. We provide commentary based on historical data and analyst forecasts only using an unbiased methodology and our articles are not intended to be financial advice. It does not constitute a recommendation to buy or sell any stock, and does not take account of your objectives, or your financial situation. We aim to bring you long-term focused analysis driven by fundamental data. Note that our analysis may not factor in the latest price-sensitive company announcements or qualitative material. Simply Wall St has no position in any stocks mentioned.