
- LIVE QUOTES
- LEARN
- HELP
 Nasdaq
 Wall Street Journal
EN
Assessing DIC (TSE:4631) Valuation After Recent Share Price Softness And Longer Term Gains
DIC (TSE:4631) is back on investor radars after its recent share price softness, including a 1 day decline of about 1% and a month pullback of roughly 3%, prompting fresh interest in its fundamentals.
See our latest analysis for DIC.
That recent 1 day and 1 month share price pullback sits against a much stronger picture in total shareholder return, with a 1 year gain of 13.7% and around 74% over three years. This suggests longer term momentum while near term enthusiasm has cooled.
If this mix of short term weakness and longer term strength has you thinking about what else is out there, it could be a good moment to broaden your search with fast growing stocks with high insider ownership.
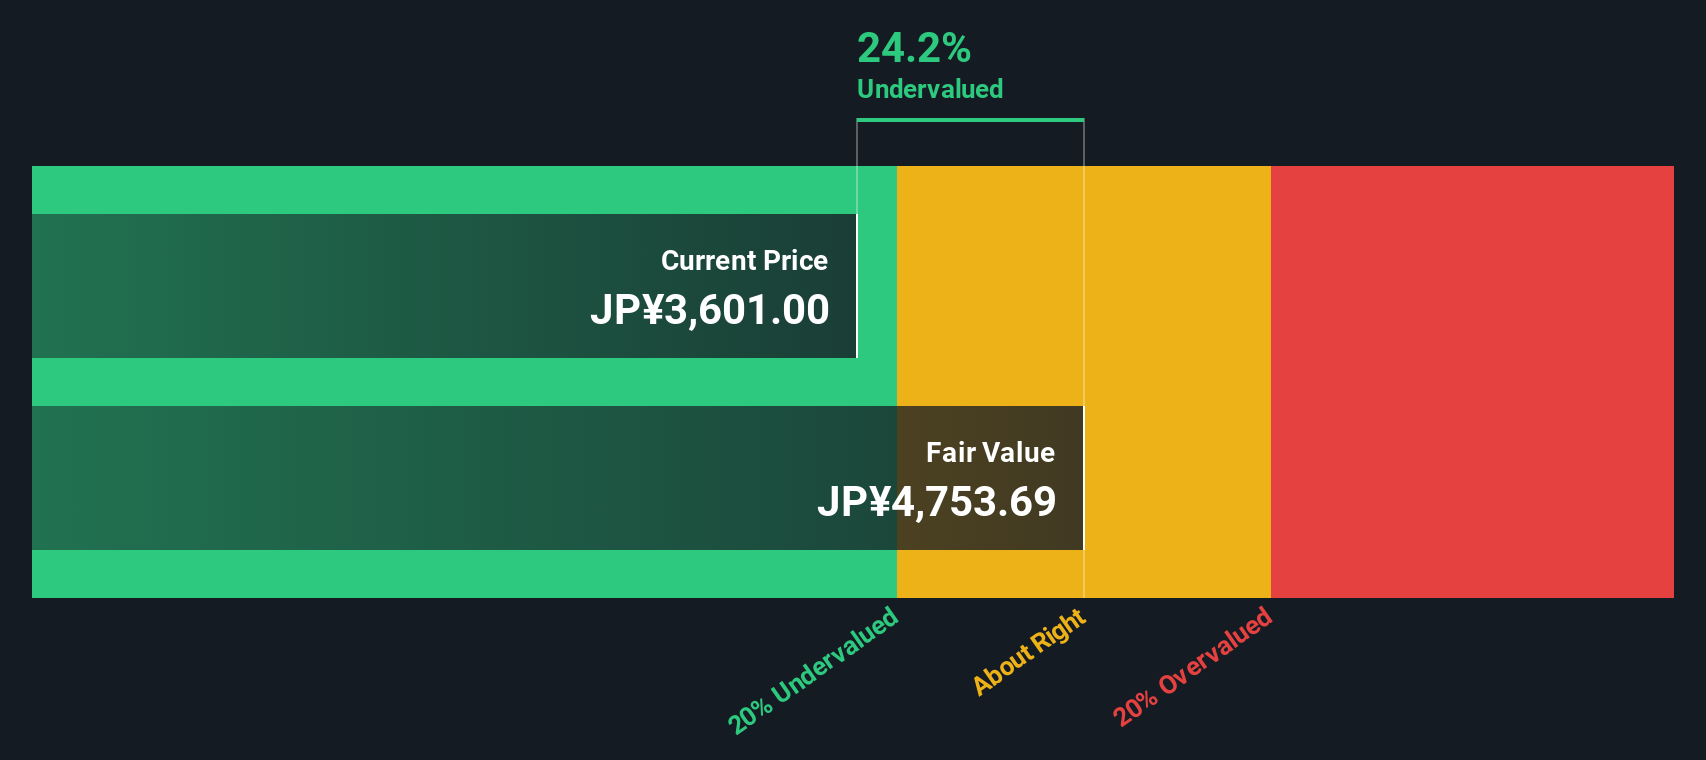
With DIC trading at ¥3,617 and indications of both an intrinsic discount and a gap to analyst targets, the key question is whether this reflects an undervalued compounding story or a price that already factors in future growth.
Price-to-Earnings of 10.6x: Is it justified?
On a P/E of 10.6x at a last close of ¥3,617, DIC screens as undervalued compared to both its own fair ratio and the broader chemicals peer group.
The P/E multiple tells you how much investors are paying for each unit of current earnings. It is a common yardstick for established, profitable companies like DIC in the chemicals space.
DIC is flagged as trading at good value against a peer average P/E of 19.2x and the Japan chemicals industry average of 12.9x, suggesting the market is pricing its earnings more conservatively than many competitors. Against an estimated fair P/E of 14.6x, its current 10.6x level also sits at a clear discount, indicating that the valuation multiple may move closer to that fair ratio if sentiment aligns with underlying earnings.
Explore the SWS fair ratio for DIC
Result: Price-to-Earnings of 10.6x (UNDERVALUED)
However, you still need to weigh risks such as relatively modest 1.3% annual revenue growth and the possibility that analyst price targets may not materialise.
Find out about the key risks to this DIC narrative.
Another View: What Our DCF Model Says
The P/E suggests DIC looks inexpensive, but our DCF model goes further and points to a fair value of ¥5,468.61 versus the current ¥3,617. That implies a sizeable gap, which could signal opportunity or simply highlight how much faith you put in long term cash flow assumptions.
Look into how the SWS DCF model arrives at its fair value.
Simply Wall St performs a discounted cash flow (DCF) on every stock in the world every day (check out DIC for example). We show the entire calculation in full. You can track the result in your watchlist or portfolio and be alerted when this changes, or use our stock screener to discover 868 undervalued stocks based on their cash flows. If you save a screener we even alert you when new companies match - so you never miss a potential opportunity.
Build Your Own DIC Narrative
If you look at the numbers and reach a different conclusion, or simply prefer to run your own checks, you can shape a fresh view in minutes, Do it your way.
A great starting point for your DIC research is our analysis highlighting 4 key rewards and 3 important warning signs that could impact your investment decision.
Looking for more investment ideas?
If DIC is on your radar, do not stop there. The wider market holds plenty of other opportunities that could fit your style and time horizon.
- Target income-focused opportunities by scanning these 14 dividend stocks with yields > 3% that may offer more consistent cash returns than a single company can provide.
- Back the growth potential of transformative technology with these 25 AI penny stocks that are tied to advances in artificial intelligence across multiple sectors.
- Hunt for mispriced opportunities using these 868 undervalued stocks based on cash flows that might suit investors who want potential upside backed by current cash flow signals.
This article by Simply Wall St is general in nature. We provide commentary based on historical data and analyst forecasts only using an unbiased methodology and our articles are not intended to be financial advice. It does not constitute a recommendation to buy or sell any stock, and does not take account of your objectives, or your financial situation. We aim to bring you long-term focused analysis driven by fundamental data. Note that our analysis may not factor in the latest price-sensitive company announcements or qualitative material. Simply Wall St has no position in any stocks mentioned.
Have feedback on this article? Concerned about the content? Get in touch with us directly. Alternatively, email editorial-team@simplywallst.com