
- LIVE QUOTES
- LEARN
- HELP
 Nasdaq
 Wall Street Journal
EN
Is Bayer (XTRA:BAYN) Still Attractive After A 94% One Year Share Price Surge?
- If you are wondering whether Bayer at around €38.00 is still offering value after a strong run, this article will walk through what the current price actually reflects.
- Bayer's share price shows a mixed return profile, with a 4.4% move over 7 days, 14.1% over 30 days, 93.6% over 1 year, and longer term returns of a 23.0% decline over 3 years and a 16.0% decline over 5 years.
- Recent news around Bayer has focused on its ongoing portfolio and restructuring efforts as well as continued attention on legal and balance sheet issues, which have shaped investor sentiment at different points. These factors sit in the background as investors assess how much uncertainty is already reflected in the current share price.
- Bayer currently records a value score of 5 out of 6. Next we will look at the traditional valuation checks behind that number before finishing with a more complete way to think about what the stock could be worth over time.
Approach 1: Bayer Discounted Cash Flow (DCF) Analysis
A Discounted Cash Flow model takes estimates of a company’s future cash flows and discounts them back to today’s value, so you can compare that number with the current share price.
For Bayer, the model used is a 2 Stage Free Cash Flow to Equity approach. The latest twelve month free cash flow is about €3.93b. Analyst inputs and subsequent extrapolations feed into a ten year path of projected free cash flows, which for 2030 is around €6.41b. Beyond the years covered by analysts, Simply Wall St extends the series using its own growth assumptions.
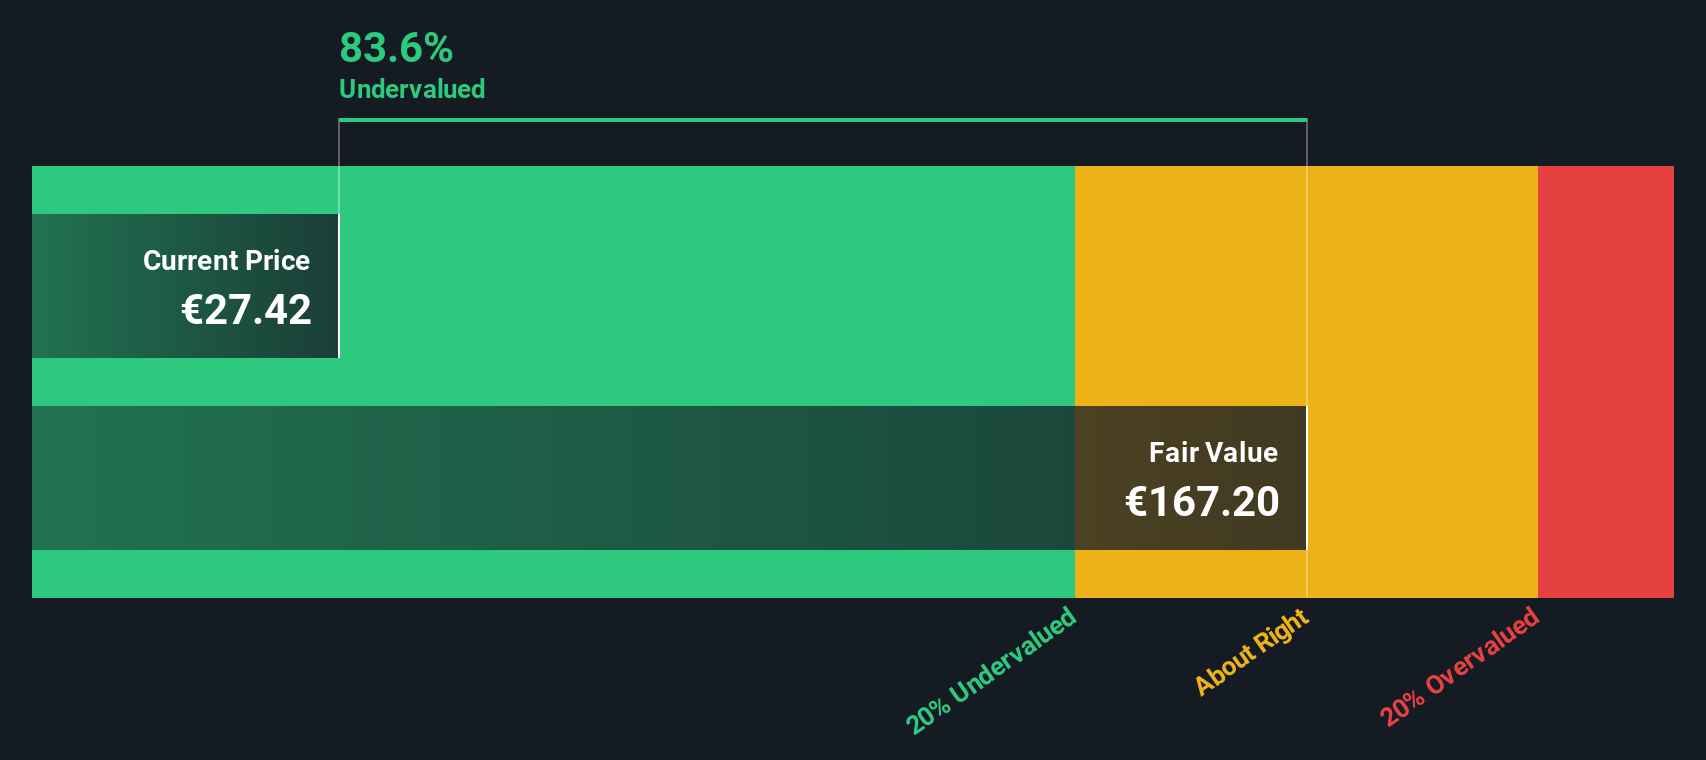
Bringing all of those projected cash flows back to today and adding a terminal value produces an estimated intrinsic value of €194.07 per share. Compared with a current share price around €38.00, this model implies the stock is 80.4% undervalued.
Result: UNDERVALUED
Our Discounted Cash Flow (DCF) analysis suggests Bayer is undervalued by 80.4%. Track this in your watchlist or portfolio, or discover 875 more undervalued stocks based on cash flows.
Approach 2: Bayer Price vs Sales
For companies where earnings can be affected by one off items, the P/S ratio is often a useful way to think about value because it compares the share price to the revenue the business is generating, rather than to short term profit swings.
What investors are usually weighing up is how fast sales might grow over time and how risky those sales are. Higher expected growth and lower perceived risk can justify a higher P/S multiple, while slower growth or higher uncertainty tends to point to a lower, more cautious range.
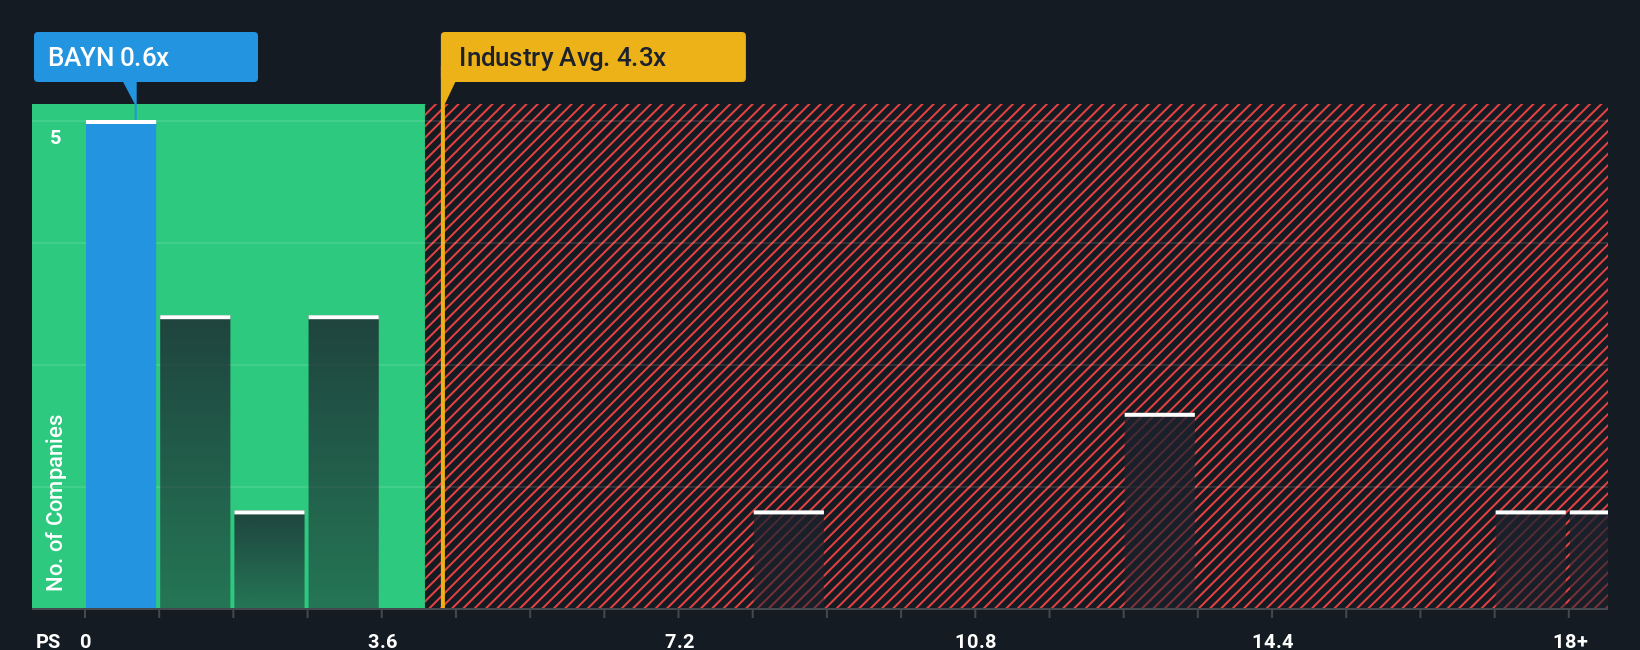
Bayer currently trades on a P/S of 0.81x, compared with the Pharmaceuticals industry average of 2.66x and a peer group average of 2.60x. Simply Wall St’s Fair Ratio for Bayer is 2.04x, which is its own estimate of a suitable P/S level once factors like growth profile, profit margins, industry, market size and company specific risks are considered.
This Fair Ratio can be more informative than a basic peer or industry comparison because it adjusts for those company specific attributes rather than assuming all firms deserve similar multiples. With Bayer’s current 0.81x P/S sitting below the 2.04x Fair Ratio, the shares screen as undervalued on this metric.
Result: UNDERVALUED
P/S ratios tell one story, but what if the real opportunity lies elsewhere? Discover 1466 companies where insiders are betting big on explosive growth.
Upgrade Your Decision Making: Choose your Bayer Narrative
Earlier we mentioned that there is an even better way to understand valuation, so let us introduce you to Narratives. These are simple stories you create about Bayer that connect your view on its future revenue, earnings and margins to a financial forecast, a fair value, and a clear comparison with today’s share price. All of this happens within the Narratives tool on Simply Wall St’s Community page, where millions of investors share their views. You can, for example, see one investor building a Narrative that leans on the higher analyst assumptions such as earnings of €4.2b with a P/E of 11.7x and a fair value around €39.0. Another investor might take the more cautious end of the range with earnings of €2.0b, a P/E closer to 10.6x and a fair value near €23.0. You can then use those different fair values versus the current price to help you decide whether Bayer looks closer to fully priced or potentially mispriced to you, with each Narrative updating as new earnings, news or litigation developments are incorporated.
Do you think there's more to the story for Bayer? Head over to our Community to see what others are saying!

This article by Simply Wall St is general in nature. We provide commentary based on historical data and analyst forecasts only using an unbiased methodology and our articles are not intended to be financial advice. It does not constitute a recommendation to buy or sell any stock, and does not take account of your objectives, or your financial situation. We aim to bring you long-term focused analysis driven by fundamental data. Note that our analysis may not factor in the latest price-sensitive company announcements or qualitative material. Simply Wall St has no position in any stocks mentioned.
Have feedback on this article? Concerned about the content? Get in touch with us directly. Alternatively, email editorial-team@simplywallst.com