
- LIVE QUOTES
- LEARN
- HELP
 Nasdaq
 Wall Street Journal
EN
Assessing General Motors’ Valuation After a 58% 12-Month Shareholder Return
General Motors (GM) has quietly climbed over the past few months, and with the stock hovering around 81 dollars after a strong year long run, investors are wondering whether this momentum still looks reasonable.
See our latest analysis for General Motors.
Over the past year, investors have been rewarded with a 12 month total shareholder return of 58.04 percent. A 90 day share price return of 39.16 percent shows momentum is still firmly building despite a softer recent pullback.
If GM’s recent run has you thinking about the broader auto space, it could be a good time to see what else is moving among auto manufacturers.
With GM now trading slightly above analyst targets yet still at a discount to some intrinsic value estimates, the key question is clear: is there still a buying opportunity here, or is the market already pricing in future growth?
Most Popular Narrative: 1.9% Overvalued
With General Motors closing at $80.98 against a narrative fair value near $79.46, the current price only slightly overshoots that long term roadmap.
GM's rapid expansion of its electric vehicle (EV) portfolio especially through crossover success, luxury Cadillac EV leadership, and affordable models like the Equinox EV positions the company to gain market share and drive revenue growth as global electrification accelerates and consumer demand recovers.
Curious how slow top line growth, rising margins, and aggressive buybacks can still justify today’s price? The narrative stitches these moving parts into one tight valuation story, built on detailed earnings paths and a future profit multiple that might surprise you.
Result: Fair Value of $79.46 (OVERVALUED)
Have a read of the narrative in full and understand what's behind the forecasts.
However, persistent tariff headwinds and slower than expected EV adoption could quickly compress margins and undermine the optimistic earnings path embedded in today’s price.
Find out about the key risks to this General Motors narrative.
Another Angle on Value
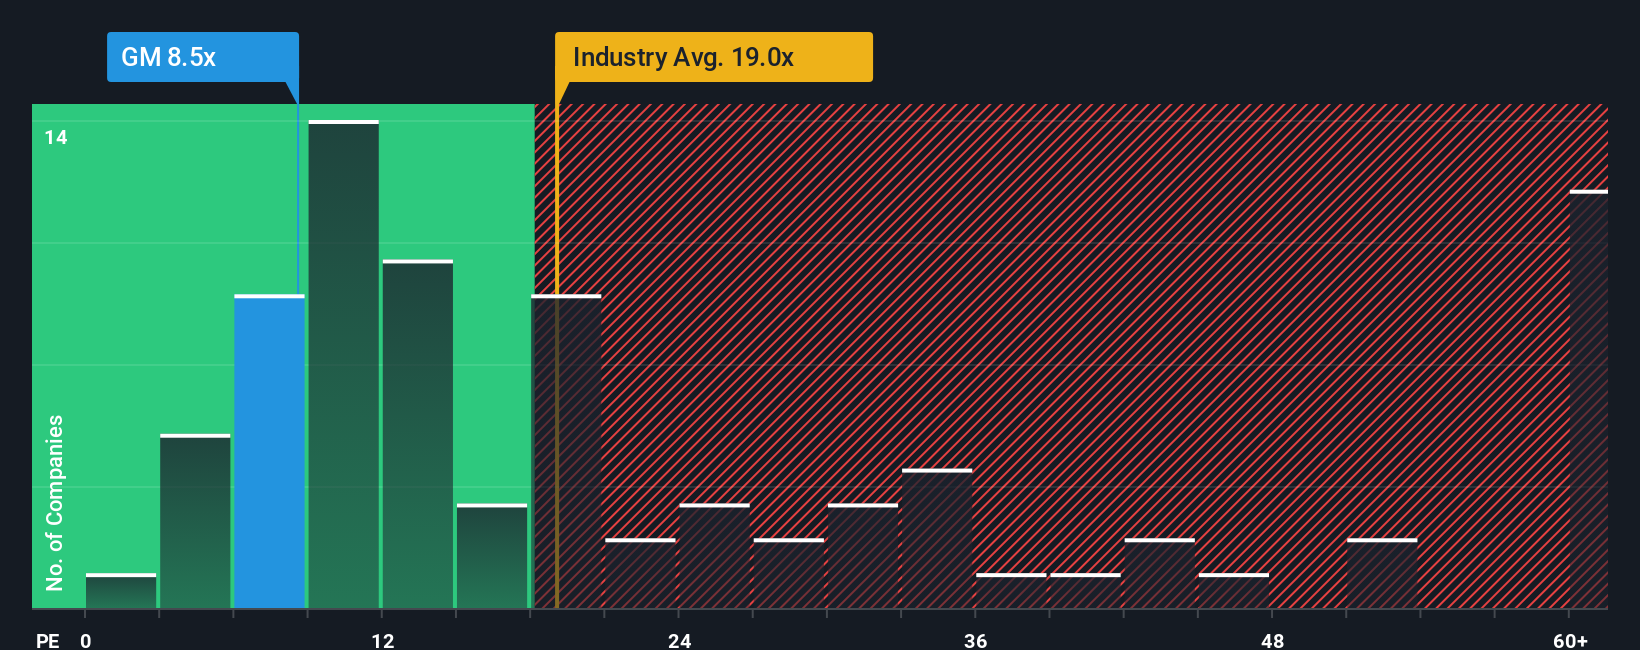
While the narrative model says GM is about 1.9 percent over fair value, the earnings based lens tells a different story. At 15.9 times earnings, GM trades cheaper than both global autos at 18.5 times and its peer average of 22.2 times, versus a fair ratio of 20.7 times.
That gap suggests the market still prices in a meaningful dose of caution, not optimism. This could limit downside if sentiment turns, but also leaves room for rerating if GM keeps delivering on earnings and buybacks. The question is whether this represents a value cushion or a value trap in disguise.
See what the numbers say about this price — find out in our valuation breakdown.
Build Your Own General Motors Narrative
If you see the story differently or want to dig into the numbers yourself, you can build a complete narrative in just minutes, Do it your way.
A great starting point for your General Motors research is our analysis highlighting 3 key rewards and 4 important warning signs that could impact your investment decision.
Ready for your next investing move?
Do not stop at GM. Use the Simply Wall Street Screener now to spot fresh opportunities other investors will only notice after the big gains have gone.
- Capture potential bargains early by targeting companies trading below their cash flow value with these 875 undervalued stocks based on cash flows.
- Position yourself for breakthroughs in automation, data, and productivity by focusing on these 25 AI penny stocks shaping the next wave of innovation.
- Strengthen your portfolio’s income stream by zeroing in on these 14 dividend stocks with yields > 3% that can boost returns even when markets stall.
This article by Simply Wall St is general in nature. We provide commentary based on historical data and analyst forecasts only using an unbiased methodology and our articles are not intended to be financial advice. It does not constitute a recommendation to buy or sell any stock, and does not take account of your objectives, or your financial situation. We aim to bring you long-term focused analysis driven by fundamental data. Note that our analysis may not factor in the latest price-sensitive company announcements or qualitative material. Simply Wall St has no position in any stocks mentioned.
Have feedback on this article? Concerned about the content? Get in touch with us directly. Alternatively, email editorial-team@simplywallst.com