
- LIVE QUOTES
- LEARN
- HELP
 Nasdaq
 Wall Street Journal
EN
Celestica (TSX:CLS): Reassessing Valuation After Inclusion in S&P International 700 and Global 1200 Indexes
Celestica (TSX:CLS) just earned a spot in both the S&P International 700 and the S&P Global 1200, a shift that can quietly reshape who owns the stock and how it trades.
See our latest analysis for Celestica.
That visibility boost comes on top of a big run, with a 90 day share price return of 26.23% and a striking one year total shareholder return of 196.32%, suggesting momentum is still very much intact.
If Celestica is on your radar, this could also be a good time to scan the broader tech space and see what other stories are developing in high growth tech and AI stocks.
Yet even after this surge, Celestica still trades at a sizable discount to analyst targets. This raises a key question: is the market underestimating its earnings power, or is it already baking in years of future growth?
Most Popular Narrative: 27.2% Undervalued
With Celestica last closing at CA$414.70 against a narrative fair value near CA$570, the implied upside rests on aggressive growth and richer future profitability.
Shifting mix toward high margin end markets (A&D, industrial, healthtech) and value added services (full rack integration, after market, design, and services) is expected to drive net margin expansion and enhance earnings quality, particularly from 2026 onward. Strategic capacity investments and disciplined capital allocation (low leverage, targeted M&A, service integration) are building sustainable operating scale and technological capability, supporting continued operational margin gains and higher free cash flow conversion.
Curious how double digit growth, rising margins and a premium future earnings multiple all fit together into that fair value? The full narrative unpacks the precise revenue ramp, profit step up and valuation reset that have to happen in sequence for this upside case to hold.
Result: Fair Value of $569.94 (UNDERVALUED)
Have a read of the narrative in full and understand what's behind the forecasts.
However, heavy reliance on a few hyperscaler customers and execution risk around 800G and 1.6T ramps could quickly challenge that upside case.
Find out about the key risks to this Celestica narrative.
Another Angle on Valuation
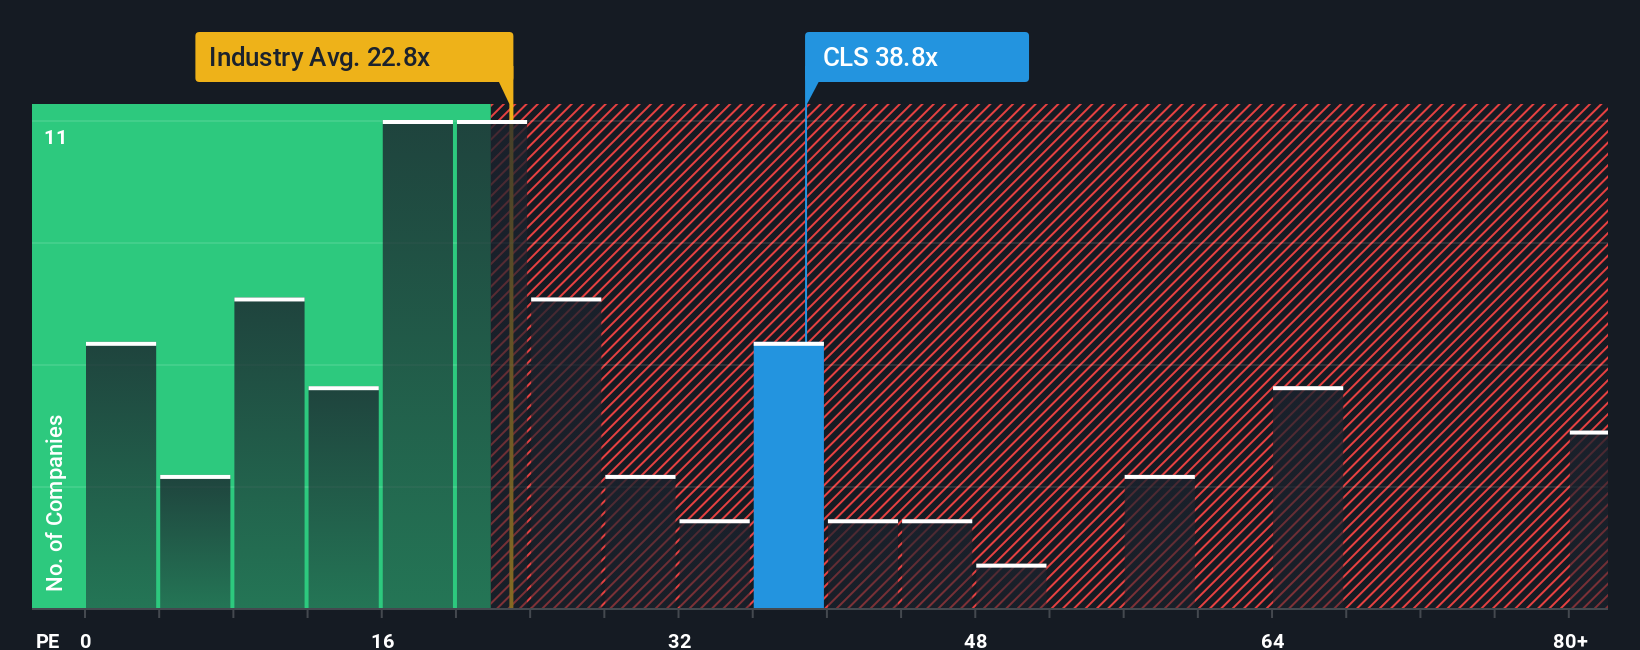
Step away from narratives and the numbers look harsher. On earnings, Celestica trades at 48.5 times profits, richer than both the North American electronic industry at 24.7 times and peers at 33.4 times, and even above a 46.9 times fair ratio that the market could drift back toward.
That kind of premium can work while growth beats expectations, but it also leaves less room for disappointment if AI demand or hyperscaler spend cools. How comfortable are you paying up at this stage of the cycle?
See what the numbers say about this price — find out in our valuation breakdown.
Build Your Own Celestica Narrative
If you see things differently or prefer to dig into the numbers yourself, you can build a complete narrative in just minutes: Do it your way.
A good starting point is our analysis highlighting 3 key rewards investors are optimistic about regarding Celestica.
Ready for more investment ideas?
Before you move on, lock in your next set of opportunities with focused screeners that surface strong trends, resilient business models and under the radar potential.
- Capture potential multi baggers early by zeroing in on these 3571 penny stocks with strong financials with resilient balance sheets and room for significant upside if sentiment turns.
- Position ahead of the next tech wave by targeting these 25 AI penny stocks tapping real world adoption in automation, data infrastructure and intelligent software.
- Strengthen long term income and total return by focusing on these 14 dividend stocks with yields > 3% that combine healthy payouts with sustainable business economics.
This article by Simply Wall St is general in nature. We provide commentary based on historical data and analyst forecasts only using an unbiased methodology and our articles are not intended to be financial advice. It does not constitute a recommendation to buy or sell any stock, and does not take account of your objectives, or your financial situation. We aim to bring you long-term focused analysis driven by fundamental data. Note that our analysis may not factor in the latest price-sensitive company announcements or qualitative material. Simply Wall St has no position in any stocks mentioned.
Have feedback on this article? Concerned about the content? Get in touch with us directly. Alternatively, email editorial-team@simplywallst.com