
- LIVE QUOTES
- LEARN
- HELP
 Nasdaq
 Wall Street Journal
EN
Is It Too Late To Consider T1 Energy After Its 171.3% Share Price Surge?
- Wondering if T1 Energy is still a bargain after its big run, or if you are turning up just as the value story is fading? This breakdown is built to answer that exact question.
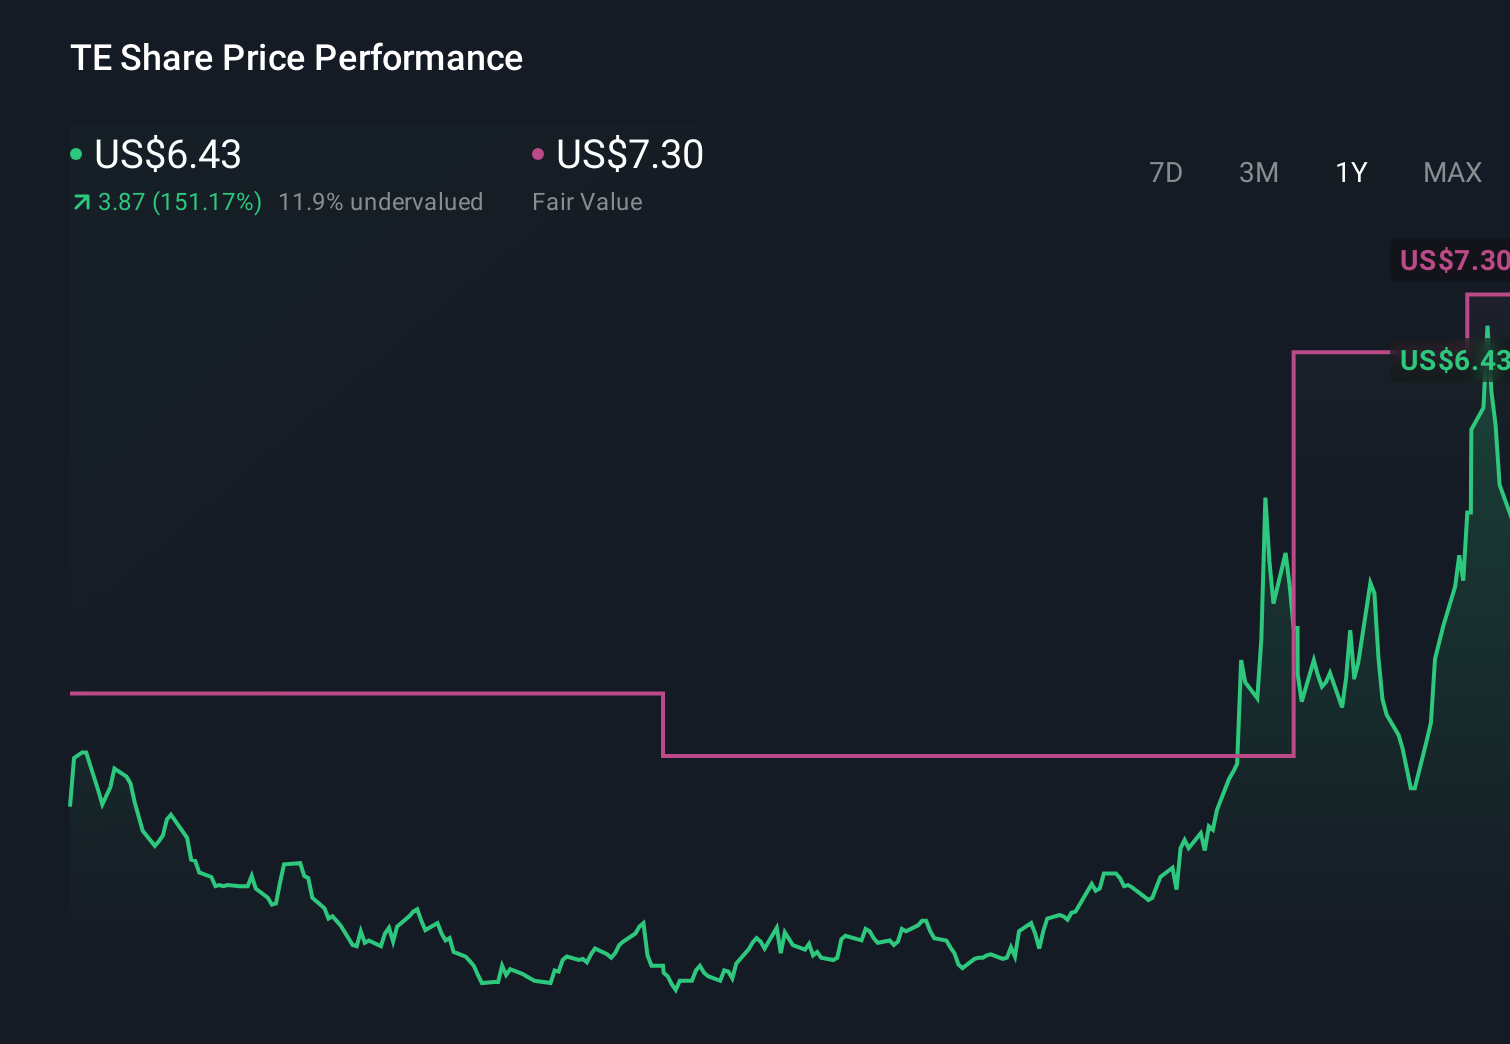
- The stock has surged 15.3% over the last week and 34.5% over the past month, capping off a huge 171.3% gain over the last year despite a flat YTD performance and weak longer term returns.
- Recent attention has centered on T1 Energy's push into new project contracts and strategic partnerships, which investors see as potential catalysts for more stable cash flows. The stock has also featured in several sector roundups highlighting smaller energy names that could benefit from shifting capital away from traditional majors.
- Right now T1 Energy scores a 3/6 valuation check. This suggests it screens as undervalued on half of our metrics. Next we will unpack those methods before exploring a more nuanced way to think about what the market might really be pricing in.
Approach 1: T1 Energy Discounted Cash Flow (DCF) Analysis
A Discounted Cash Flow model takes projected future cash flows, then discounts them back to today to estimate what the business is worth right now. For T1 Energy, the starting point is last twelve month Free Cash Flow of around -$380 million, reflecting a company still in an investment heavy phase.
Analysts expect cash flows to gradually improve, with projections turning positive and reaching about $350 million by 2029. Beyond the explicit analyst horizon, Simply Wall St extrapolates cash flows using a 2 Stage Free Cash Flow to Equity approach, which shows FCF rising further over the following years as growth moderates.
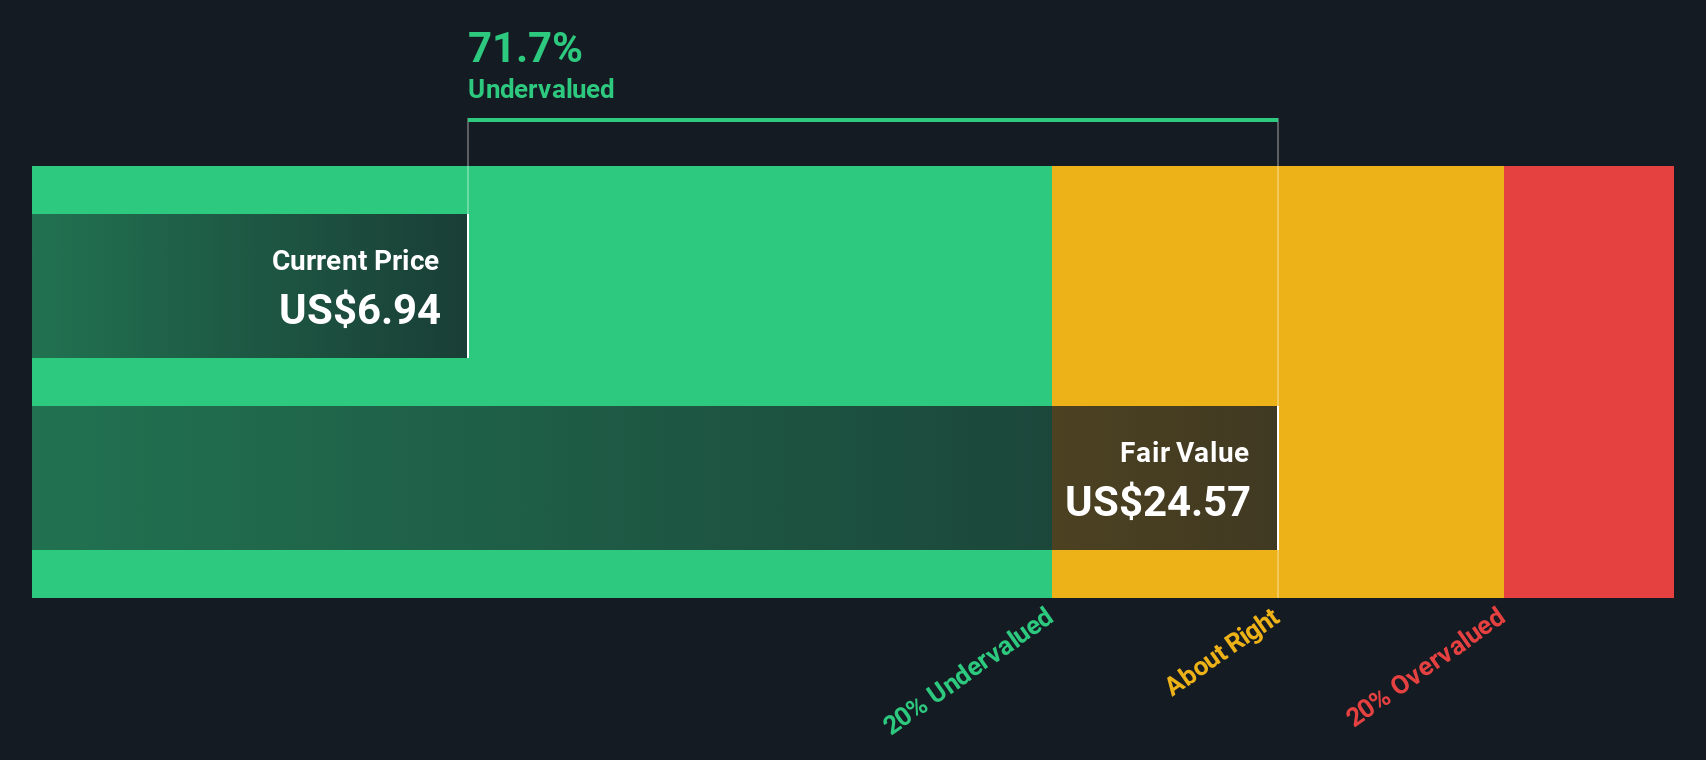
When those projected cash flows are discounted back to today, the model produces an estimated intrinsic value of roughly $25.78 per share. Compared with the current share price, this suggests T1 Energy may be trading at a significant discount to its DCF value, indicating the market could be heavily discounting its long term cash flow potential.
Result: UNDERVALUED
Our Discounted Cash Flow (DCF) analysis suggests T1 Energy is undervalued by 69.6%. Track this in your watchlist or portfolio, or discover 875 more undervalued stocks based on cash flows.
Approach 2: T1 Energy Price vs Sales
For companies where profits are still volatile or negative, price to sales is often a more realistic way to value the business because it anchors on revenue traction rather than earnings that can swing with investment cycles. Investors generally accept paying a higher sales multiple for faster, more predictable growth and lower perceived risk, while slower or riskier names usually trade on lower, more conservative multiples.
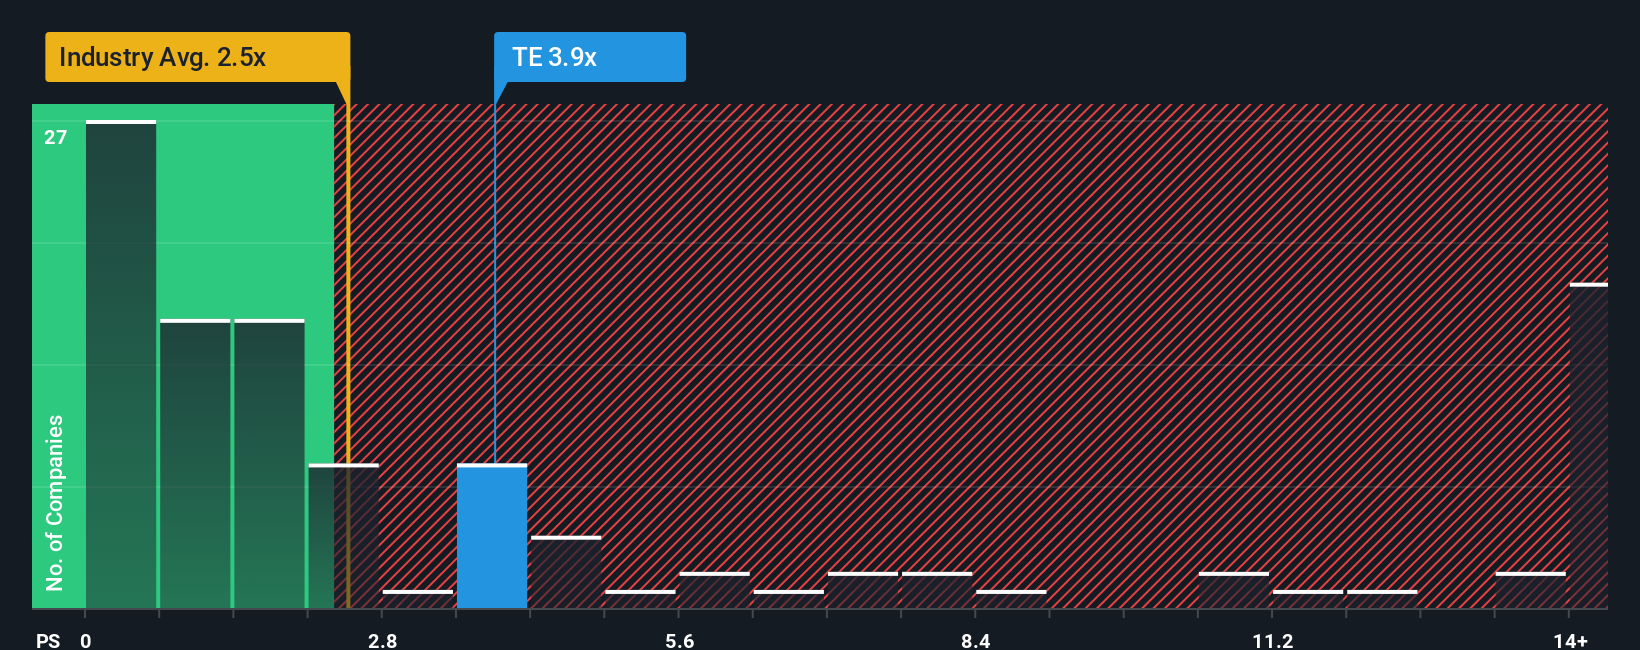
T1 Energy currently trades on a price to sales ratio of about 5.15x, well above the Electrical industry average of roughly 2.02x and also ahead of the broader peer group at around 29.41x, which is skewed by a few richly valued names. To move beyond these blunt comparisons, Simply Wall St uses a proprietary Fair Ratio, which estimates what a sensible multiple should be once you factor in growth prospects, profitability profile, size, sector and key risks.
On this framework, T1 Energy’s Fair Ratio comes out at about 3.74x, which indicates the market is paying a premium to what its fundamentals would typically justify. That gap suggests the stock appears expensive on a price to sales basis, with the valuation already reflecting optimistic expectations.
Result: OVERVALUED
PS ratios tell one story, but what if the real opportunity lies elsewhere? Discover 1464 companies where insiders are betting big on explosive growth.
Upgrade Your Decision Making: Choose your T1 Energy Narrative
Earlier we mentioned that there is an even better way to understand valuation, so let us introduce you to Narratives, a simple way to turn your view of T1 Energy into a structured story that links what you think will happen to the business, to a forecast for its future revenue, earnings and margins, and then to a Fair Value you can easily compare with today’s share price. On Simply Wall St’s Community page, used by millions of investors, Narratives let you plug in or adapt assumptions. This way you can see how a more optimistic view of T1’s Texas expansion and policy support might justify a higher Fair Value, while a more cautious view that focuses on dilution, policy risk and margin pressure points to a lower Fair Value and potentially a different buy or sell decision. Because each Narrative automatically updates as fresh news, earnings or guidance arrives, you are not locked into a static model. You can see in real time whether the story you believe in still stacks up against the latest information and the current market price.
Do you think there's more to the story for T1 Energy? Head over to our Community to see what others are saying!
This article by Simply Wall St is general in nature. We provide commentary based on historical data and analyst forecasts only using an unbiased methodology and our articles are not intended to be financial advice. It does not constitute a recommendation to buy or sell any stock, and does not take account of your objectives, or your financial situation. We aim to bring you long-term focused analysis driven by fundamental data. Note that our analysis may not factor in the latest price-sensitive company announcements or qualitative material. Simply Wall St has no position in any stocks mentioned.
Have feedback on this article? Concerned about the content? Get in touch with us directly. Alternatively, email editorial-team@simplywallst.com