
- LIVE QUOTES
- LEARN
- HELP
 Nasdaq
 Wall Street Journal
EN
Hargreaves Services And 2 UK Dividend Stocks To Enhance Your Portfolio
As the United Kingdom's FTSE 100 index experiences fluctuations amid global economic uncertainties, particularly influenced by China's sluggish recovery, investors are increasingly seeking stability through dividend stocks. In such a volatile environment, companies like Hargreaves Services and others that offer consistent dividend payouts can provide a reliable income stream and potentially enhance portfolio resilience.
Top 10 Dividend Stocks In The United Kingdom
| Name | Dividend Yield | Dividend Rating |
| Seplat Energy (LSE:SEPL) | 6.74% | ★★★★★☆ |
| RS Group (LSE:RS1) | 3.59% | ★★★★★☆ |
| MONY Group (LSE:MONY) | 6.82% | ★★★★★★ |
| Keller Group (LSE:KLR) | 3.09% | ★★★★★☆ |
| Impax Asset Management Group (AIM:IPX) | 7.89% | ★★★★★☆ |
| IG Group Holdings (LSE:IGG) | 3.59% | ★★★★★☆ |
| ICG (LSE:ICG) | 4.11% | ★★★★☆☆ |
| Hargreaves Services (AIM:HSP) | 5.66% | ★★★★★☆ |
| Begbies Traynor Group (AIM:BEG) | 3.88% | ★★★★★☆ |
| 4imprint Group (LSE:FOUR) | 4.58% | ★★★★★☆ |
Click here to see the full list of 51 stocks from our Top UK Dividend Stocks screener.
Let's review some notable picks from our screened stocks.
Hargreaves Services (AIM:HSP)
Simply Wall St Dividend Rating: ★★★★★☆
Overview: Hargreaves Services Plc offers environmental and industrial services across the United Kingdom, Europe, Hong Kong, and internationally with a market cap of £216.20 million.
Operations: Hargreaves Services Plc generates its revenue from segments including Services (£247.69 million) and Hargreaves Land (£20.08 million).
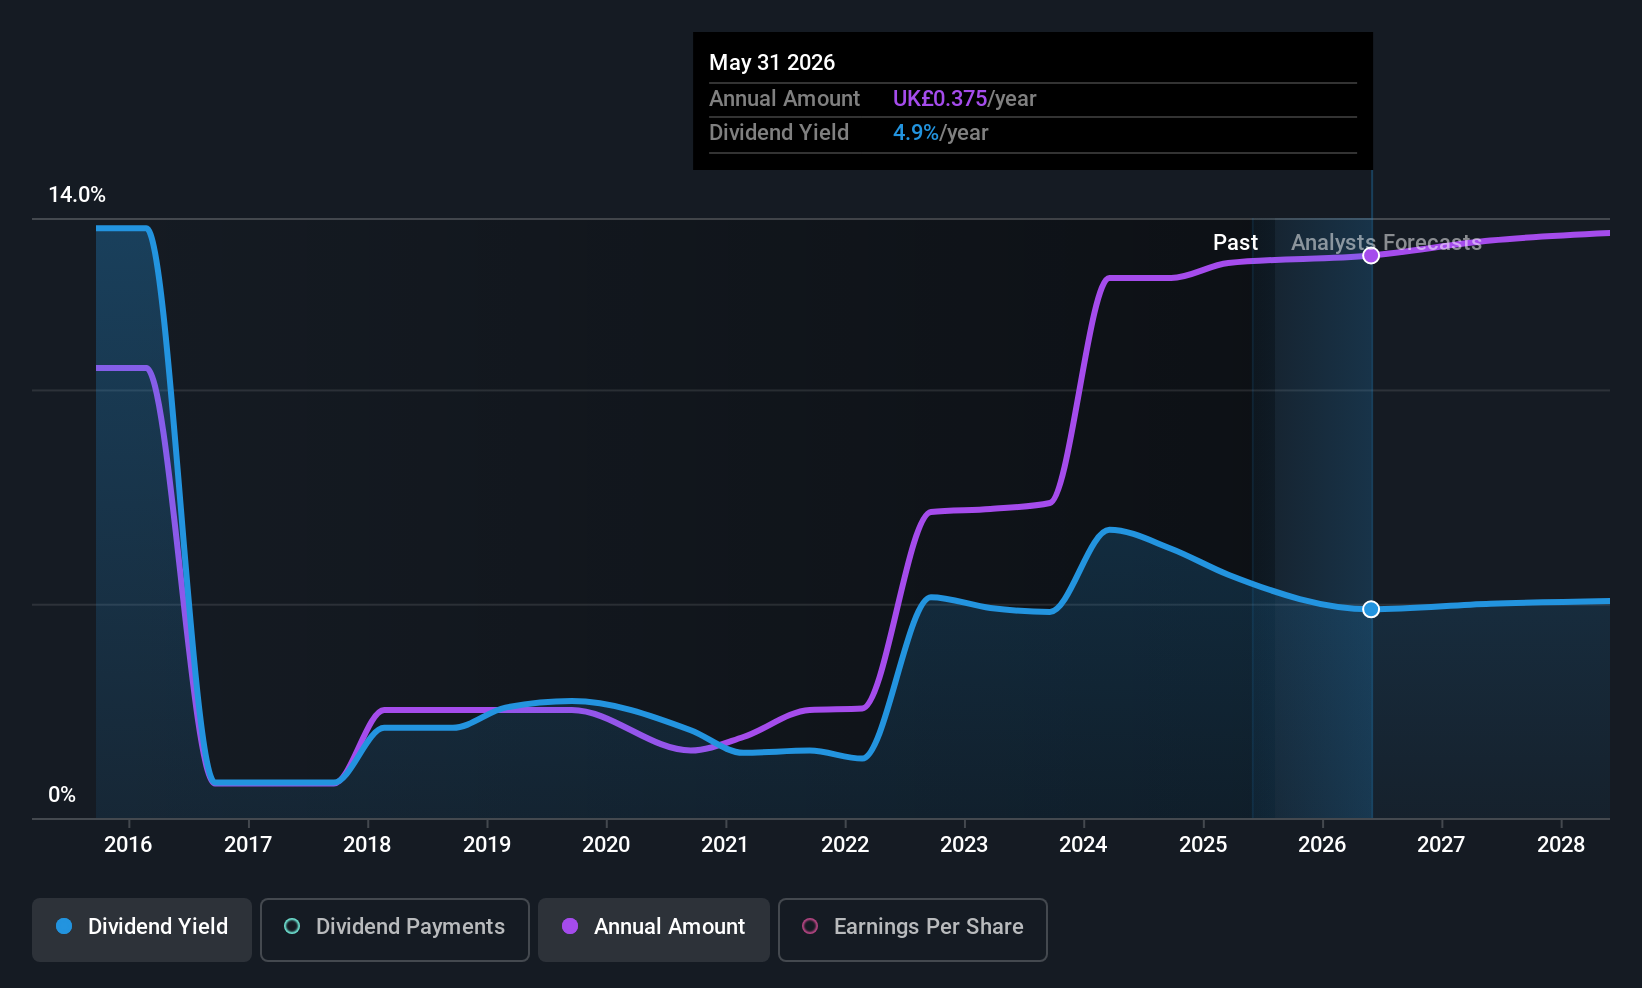
Dividend Yield: 5.7%
Hargreaves Services offers a compelling dividend yield of 5.66%, placing it among the top 25% of UK dividend payers, although its dividend history has been volatile over the past decade. The company's dividends are well-covered by both earnings and cash flows, with payout ratios of 82.5% and 47.2%, respectively. Recent guidance indicates expected growth in revenue and profit before tax for H1 FY2026, suggesting potential stability in future payouts despite past inconsistencies.
- Unlock comprehensive insights into our analysis of Hargreaves Services stock in this dividend report.
- The analysis detailed in our Hargreaves Services valuation report hints at an inflated share price compared to its estimated value.
Drax Group (LSE:DRX)
Simply Wall St Dividend Rating: ★★★★☆☆
Overview: Drax Group plc, with a market cap of £2.85 billion, operates in the United Kingdom focusing on renewable power generation through its subsidiaries.
Operations: Drax Group's revenue is derived from its segments including Energy Solutions (£3.14 billion), Pellet Production (£948.80 million), Biomass Generation (£4.58 billion), and Flexible Generation (£191.10 million).
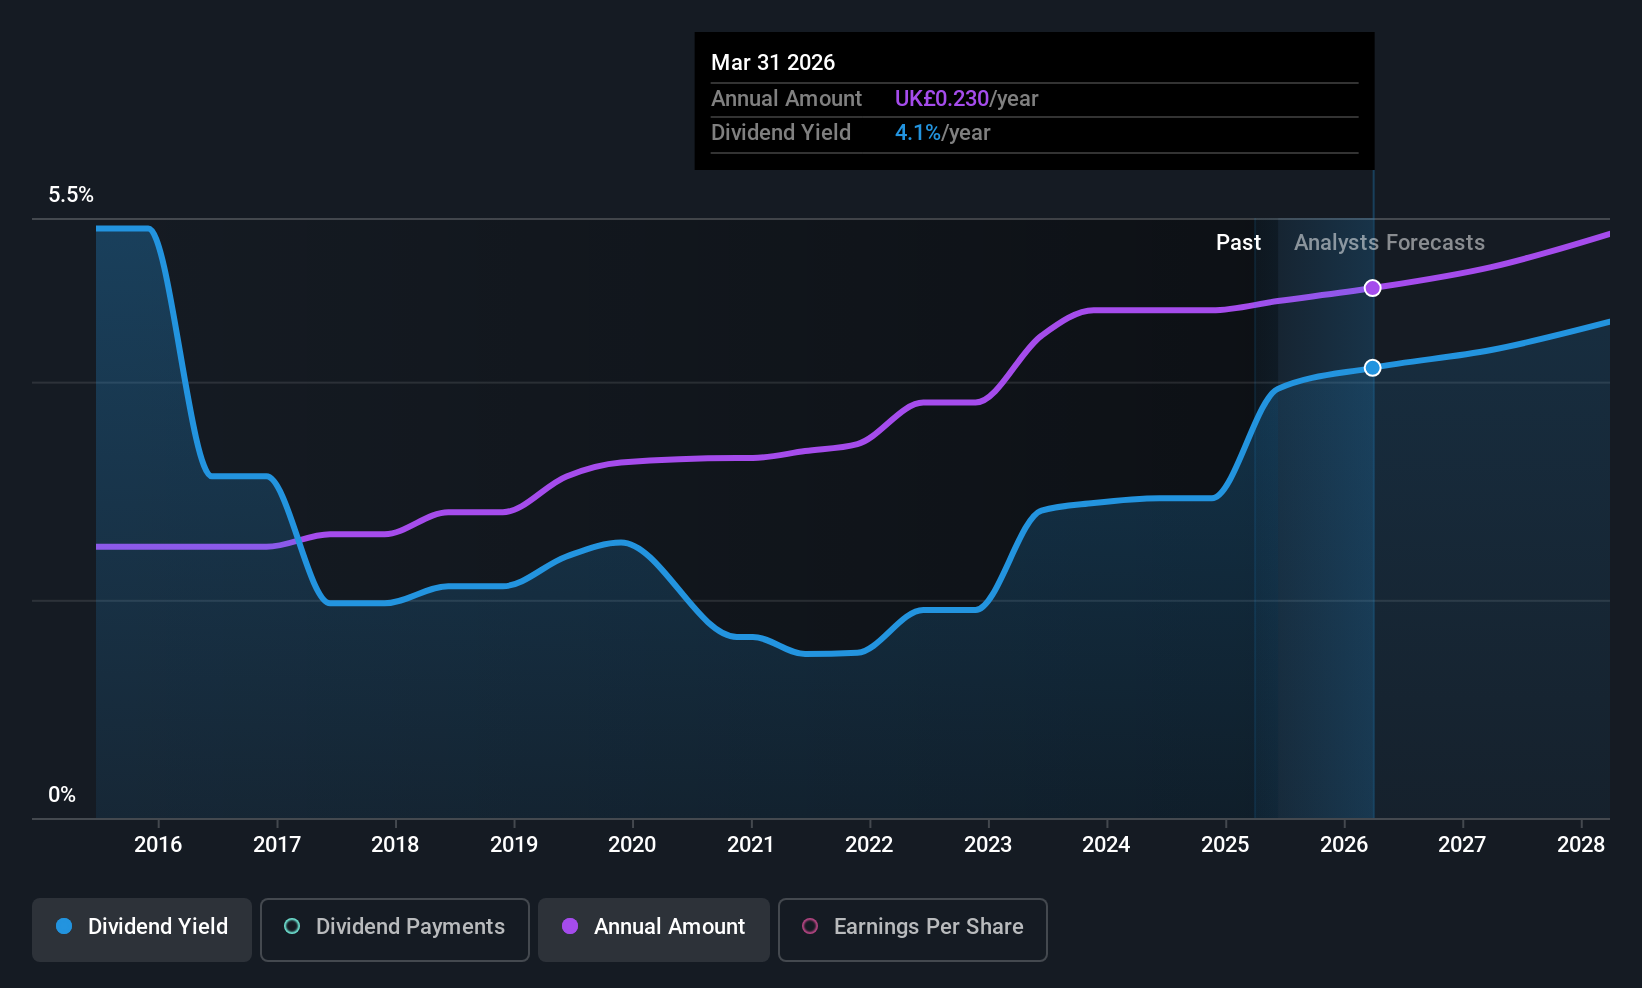
Dividend Yield: 3.2%
Drax Group's dividend yield of 3.25% is below the top 25% of UK dividend payers, with a history of volatility and unreliability over the past decade. However, its dividends are well-covered by earnings and cash flows, with low payout ratios of 24.7% and 18.1%, respectively. Despite high debt levels and forecasted earnings decline, Drax's recent low-carbon CfD agreement supports revenue stability through enhanced biomass sustainability measures, potentially benefiting future dividend reliability.
- Delve into the full analysis dividend report here for a deeper understanding of Drax Group.
- Our valuation report unveils the possibility Drax Group's shares may be trading at a discount.

RS Group (LSE:RS1)
Simply Wall St Dividend Rating: ★★★★★☆
Overview: RS Group plc, with a market cap of £2.92 billion, operates in the distribution of maintenance, repair, and operations products and service solutions across various countries including the United Kingdom, United States, France, Mexico, Germany, Italy, and Switzerland.
Operations: RS Group plc generates revenue from its Own-Brand Product and Service Solutions at £403.50 million and Other Product and Service Solutions at £2.46 billion.
Dividend Yield: 3.6%
RS Group's dividend yield of 3.59% is lower than the top UK payers but offers reliable and stable payments, covered by both earnings (payout ratio: 66.9%) and cash flows (cash payout ratio: 48.3%). The company has consistently increased dividends over the past decade, aligning with its progressive policy. Recent product expansions and strategic partnerships enhance RS Group's market presence, potentially supporting future financial stability and dividend sustainability despite a slight decline in recent sales figures (£1.40 billion).
- Dive into the specifics of RS Group here with our thorough dividend report.
- Insights from our recent valuation report point to the potential undervaluation of RS Group shares in the market.
Key Takeaways
- Click this link to deep-dive into the 51 companies within our Top UK Dividend Stocks screener.
- Got skin in the game with these stocks? Elevate how you manage them by using Simply Wall St's portfolio, where intuitive tools await to help optimize your investment outcomes.
- Streamline your investment strategy with Simply Wall St's app for free and benefit from extensive research on stocks across all corners of the world.
Ready For A Different Approach?
- Explore high-performing small cap companies that haven't yet garnered significant analyst attention.
- Fuel your portfolio with companies showing strong growth potential, backed by optimistic outlooks both from analysts and management.
- Find companies with promising cash flow potential yet trading below their fair value.
This article by Simply Wall St is general in nature. We provide commentary based on historical data and analyst forecasts only using an unbiased methodology and our articles are not intended to be financial advice. It does not constitute a recommendation to buy or sell any stock, and does not take account of your objectives, or your financial situation. We aim to bring you long-term focused analysis driven by fundamental data. Note that our analysis may not factor in the latest price-sensitive company announcements or qualitative material. Simply Wall St has no position in any stocks mentioned.
Have feedback on this article? Concerned about the content? Get in touch with us directly. Alternatively, email editorial-team@simplywallst.com