
- LIVE QUOTES
- LEARN
- HELP
 Nasdaq
 Wall Street Journal
EN
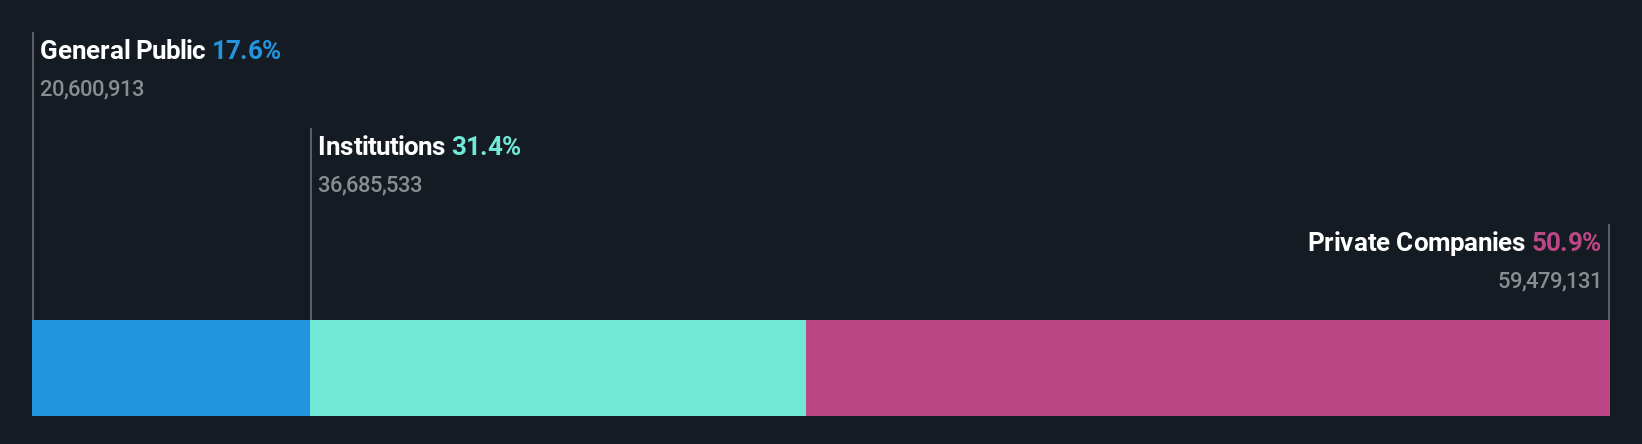
Strauss Group Ltd.'s (TLV:STRS) top owners are private companies with 51% stake, while 31% is held by institutions
Key Insights
- Significant control over Strauss Group by private companies implies that the general public has more power to influence management and governance-related decisions
- 51% of the company is held by a single shareholder (Michael Strauss Assets Ltd.)
- Institutional ownership in Strauss Group is 31%
If you want to know who really controls Strauss Group Ltd. (TLV:STRS), then you'll have to look at the makeup of its share registry. The group holding the most number of shares in the company, around 51% to be precise, is private companies. That is, the group stands to benefit the most if the stock rises (or lose the most if there is a downturn).
Institutions, on the other hand, account for 31% of the company's stockholders. Institutions will often hold stock in bigger companies, and we expect to see insiders owning a noticeable percentage of the smaller ones.
In the chart below, we zoom in on the different ownership groups of Strauss Group.
Check out our latest analysis for Strauss Group
What Does The Institutional Ownership Tell Us About Strauss Group?
Institutional investors commonly compare their own returns to the returns of a commonly followed index. So they generally do consider buying larger companies that are included in the relevant benchmark index.
We can see that Strauss Group does have institutional investors; and they hold a good portion of the company's stock. This implies the analysts working for those institutions have looked at the stock and they like it. But just like anyone else, they could be wrong. It is not uncommon to see a big share price drop if two large institutional investors try to sell out of a stock at the same time. So it is worth checking the past earnings trajectory of Strauss Group, (below). Of course, keep in mind that there are other factors to consider, too.

We note that hedge funds don't have a meaningful investment in Strauss Group. Our data shows that Michael Strauss Assets Ltd. is the largest shareholder with 51% of shares outstanding. This implies that they have majority interest control of the future of the company. The second and third largest shareholders are 1832 Asset Management L.P. and Clal Pension And Gemel Ltd, with an equal amount of shares to their name at 5.9%.
While studying institutional ownership for a company can add value to your research, it is also a good practice to research analyst recommendations to get a deeper understand of a stock's expected performance. We're not picking up on any analyst coverage of the stock at the moment, so the company is unlikely to be widely held.
Insider Ownership Of Strauss Group
The definition of company insiders can be subjective and does vary between jurisdictions. Our data reflects individual insiders, capturing board members at the very least. The company management answer to the board and the latter should represent the interests of shareholders. Notably, sometimes top-level managers are on the board themselves.
Insider ownership is positive when it signals leadership are thinking like the true owners of the company. However, high insider ownership can also give immense power to a small group within the company. This can be negative in some circumstances.
We note our data does not show any board members holding shares, personally. Given we are not picking up on insider ownership, we may have missing data. Therefore, it would be interesting to assess the CEO compensation and tenure, here.
General Public Ownership
With a 18% ownership, the general public, mostly comprising of individual investors, have some degree of sway over Strauss Group. While this size of ownership may not be enough to sway a policy decision in their favour, they can still make a collective impact on company policies.
Private Company Ownership
We can see that Private Companies own 51%, of the shares on issue. It might be worth looking deeper into this. If related parties, such as insiders, have an interest in one of these private companies, that should be disclosed in the annual report. Private companies may also have a strategic interest in the company.
Next Steps:
I find it very interesting to look at who exactly owns a company. But to truly gain insight, we need to consider other information, too. Case in point: We've spotted 2 warning signs for Strauss Group you should be aware of, and 1 of them is potentially serious.
If you would prefer check out another company -- one with potentially superior financials -- then do not miss this free list of interesting companies, backed by strong financial data.
NB: Figures in this article are calculated using data from the last twelve months, which refer to the 12-month period ending on the last date of the month the financial statement is dated. This may not be consistent with full year annual report figures.
Have feedback on this article? Concerned about the content? Get in touch with us directly. Alternatively, email editorial-team (at) simplywallst.com.
This article by Simply Wall St is general in nature. We provide commentary based on historical data and analyst forecasts only using an unbiased methodology and our articles are not intended to be financial advice. It does not constitute a recommendation to buy or sell any stock, and does not take account of your objectives, or your financial situation. We aim to bring you long-term focused analysis driven by fundamental data. Note that our analysis may not factor in the latest price-sensitive company announcements or qualitative material. Simply Wall St has no position in any stocks mentioned.