
- LIVE QUOTES
- LEARN
- HELP
 Nasdaq
 Wall Street Journal
EN
Money Forward, Inc. (TSE:3994) institutional owners may be pleased with recent gains after 3.4% loss over the past year
Key Insights
- Given the large stake in the stock by institutions, Money Forward's stock price might be vulnerable to their trading decisions
- A total of 6 investors have a majority stake in the company with 53% ownership
- 19% of Money Forward is held by insiders
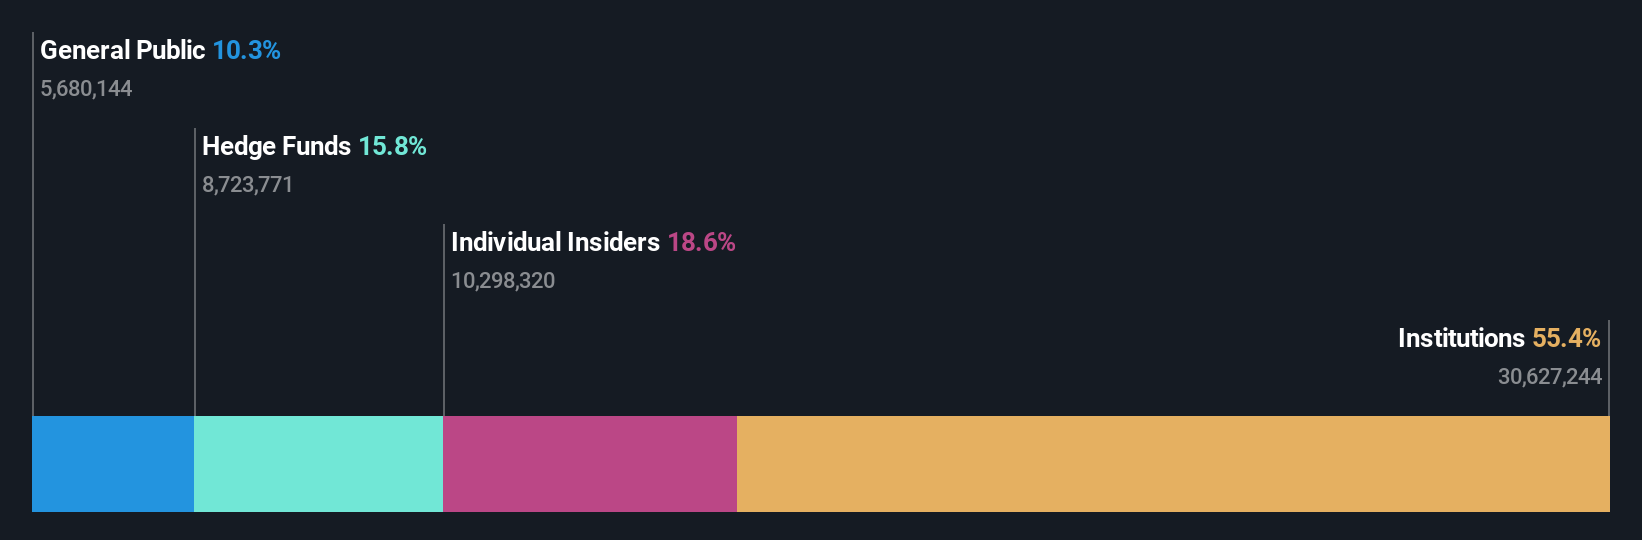
A look at the shareholders of Money Forward, Inc. (TSE:3994) can tell us which group is most powerful. With 55% stake, institutions possess the maximum shares in the company. In other words, the group stands to gain the most (or lose the most) from their investment into the company.
Institutional investors would probably welcome last week's 4.9% increase in the share price after a year of 3.4% losses as a sign that returns may to begin trending higher.
Let's take a closer look to see what the different types of shareholders can tell us about Money Forward.
View our latest analysis for Money Forward
What Does The Institutional Ownership Tell Us About Money Forward?
Institutional investors commonly compare their own returns to the returns of a commonly followed index. So they generally do consider buying larger companies that are included in the relevant benchmark index.
As you can see, institutional investors have a fair amount of stake in Money Forward. This implies the analysts working for those institutions have looked at the stock and they like it. But just like anyone else, they could be wrong. When multiple institutions own a stock, there's always a risk that they are in a 'crowded trade'. When such a trade goes wrong, multiple parties may compete to sell stock fast. This risk is higher in a company without a history of growth. You can see Money Forward's historic earnings and revenue below, but keep in mind there's always more to the story.

Since institutional investors own more than half the issued stock, the board will likely have to pay attention to their preferences. It looks like hedge funds own 16% of Money Forward shares. That catches my attention because hedge funds sometimes try to influence management, or bring about changes that will create near term value for shareholders. With a 16% stake, CEO Yosuke Tsuji is the largest shareholder. With 10% and 9.6% of the shares outstanding respectively, Baillie Gifford & Co. and ValueAct Capital Management, L.P. are the second and third largest shareholders.
On further inspection, we found that more than half the company's shares are owned by the top 6 shareholders, suggesting that the interests of the larger shareholders are balanced out to an extent by the smaller ones.
While it makes sense to study institutional ownership data for a company, it also makes sense to study analyst sentiments to know which way the wind is blowing. There are plenty of analysts covering the stock, so it might be worth seeing what they are forecasting, too.
Insider Ownership Of Money Forward
While the precise definition of an insider can be subjective, almost everyone considers board members to be insiders. Company management run the business, but the CEO will answer to the board, even if he or she is a member of it.
Most consider insider ownership a positive because it can indicate the board is well aligned with other shareholders. However, on some occasions too much power is concentrated within this group.
Our most recent data indicates that insiders own a reasonable proportion of Money Forward, Inc.. It has a market capitalization of just JP¥258b, and insiders have JP¥48b worth of shares in their own names. That's quite significant. Most would say this shows a good degree of alignment with shareholders, especially in a company of this size. You can click here to see if those insiders have been buying or selling.
General Public Ownership
The general public-- including retail investors -- own 10% stake in the company, and hence can't easily be ignored. While this group can't necessarily call the shots, it can certainly have a real influence on how the company is run.
Next Steps:
It's always worth thinking about the different groups who own shares in a company. But to understand Money Forward better, we need to consider many other factors. Consider risks, for instance. Every company has them, and we've spotted 1 warning sign for Money Forward you should know about.
But ultimately it is the future, not the past, that will determine how well the owners of this business will do. Therefore we think it advisable to take a look at this free report showing whether analysts are predicting a brighter future.
NB: Figures in this article are calculated using data from the last twelve months, which refer to the 12-month period ending on the last date of the month the financial statement is dated. This may not be consistent with full year annual report figures.
Have feedback on this article? Concerned about the content? Get in touch with us directly. Alternatively, email editorial-team (at) simplywallst.com.
This article by Simply Wall St is general in nature. We provide commentary based on historical data and analyst forecasts only using an unbiased methodology and our articles are not intended to be financial advice. It does not constitute a recommendation to buy or sell any stock, and does not take account of your objectives, or your financial situation. We aim to bring you long-term focused analysis driven by fundamental data. Note that our analysis may not factor in the latest price-sensitive company announcements or qualitative material. Simply Wall St has no position in any stocks mentioned.