
- LIVE QUOTES
- LEARN
- HELP
 Nasdaq
 Wall Street Journal
EN
Matrix IT Ltd.'s (TLV:MTRX) market cap dropped ₪280m last week; individual investors who hold 48% were hit as were institutions
Key Insights
- Significant control over Matrix IT by public companies implies that the general public has more power to influence management and governance-related decisions
- A total of 2 investors have a majority stake in the company with 55% ownership
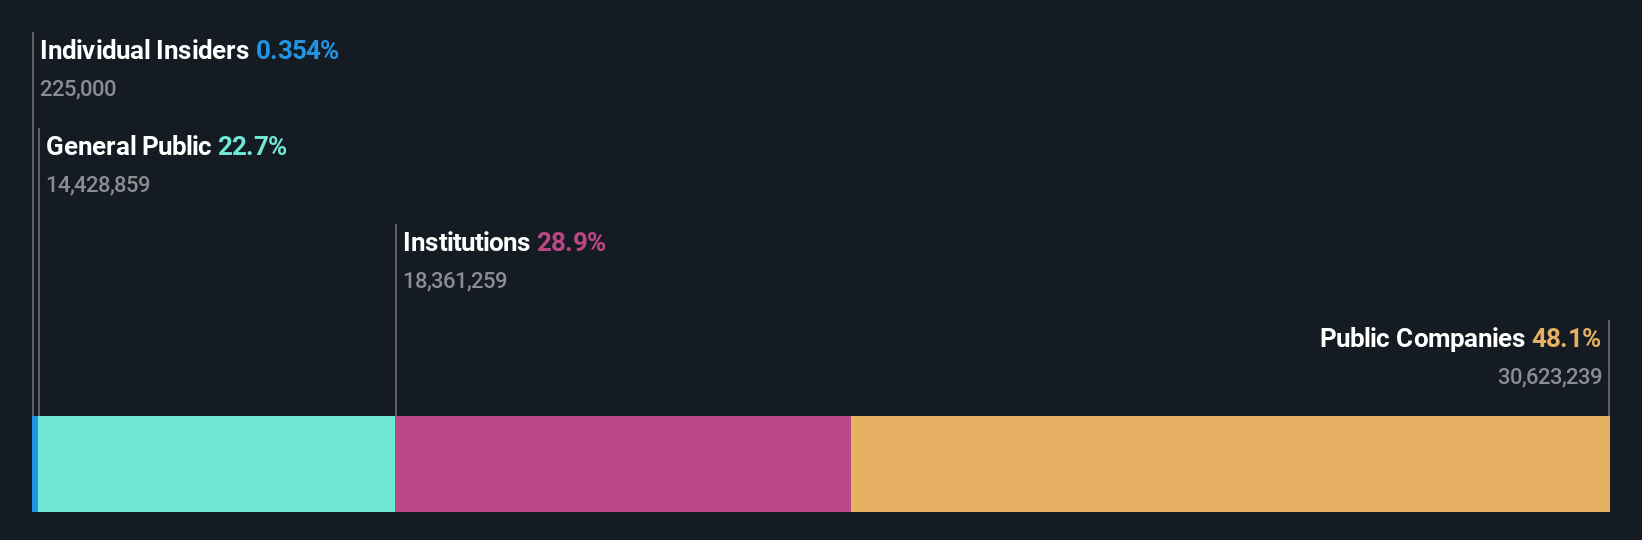
- 29% of Matrix IT is held by Institutions
Every investor in Matrix IT Ltd. (TLV:MTRX) should be aware of the most powerful shareholder groups. And the group that holds the biggest piece of the pie are public companies with 48% ownership. That is, the group stands to benefit the most if the stock rises (or lose the most if there is a downturn).
Following a 3.1% decrease in the stock price last week, public companies suffered the most losses, but institutions who own 29% stock also took a hit.
Let's delve deeper into each type of owner of Matrix IT, beginning with the chart below.
View our latest analysis for Matrix IT
What Does The Institutional Ownership Tell Us About Matrix IT?
Many institutions measure their performance against an index that approximates the local market. So they usually pay more attention to companies that are included in major indices.
As you can see, institutional investors have a fair amount of stake in Matrix IT. This suggests some credibility amongst professional investors. But we can't rely on that fact alone since institutions make bad investments sometimes, just like everyone does. When multiple institutions own a stock, there's always a risk that they are in a 'crowded trade'. When such a trade goes wrong, multiple parties may compete to sell stock fast. This risk is higher in a company without a history of growth. You can see Matrix IT's historic earnings and revenue below, but keep in mind there's always more to the story.

We note that hedge funds don't have a meaningful investment in Matrix IT. Formula Systems (1985) Ltd. is currently the company's largest shareholder with 48% of shares outstanding. For context, the second largest shareholder holds about 6.4% of the shares outstanding, followed by an ownership of 4.5% by the third-largest shareholder.
After doing some more digging, we found that the top 2 shareholders collectively control more than half of the company's shares, implying that they have considerable power to influence the company's decisions.
Researching institutional ownership is a good way to gauge and filter a stock's expected performance. The same can be achieved by studying analyst sentiments. While there is some analyst coverage, the company is probably not widely covered. So it could gain more attention, down the track.
Insider Ownership Of Matrix IT
The definition of company insiders can be subjective and does vary between jurisdictions. Our data reflects individual insiders, capturing board members at the very least. Company management run the business, but the CEO will answer to the board, even if he or she is a member of it.
Most consider insider ownership a positive because it can indicate the board is well aligned with other shareholders. However, on some occasions too much power is concentrated within this group.
Our information suggests that Matrix IT Ltd. insiders own under 1% of the company. Keep in mind that it's a big company, and the insiders own ₪31m worth of shares. The absolute value might be more important than the proportional share. Arguably, recent buying and selling is just as important to consider. You can click here to see if insiders have been buying or selling.
General Public Ownership
With a 23% ownership, the general public, mostly comprising of individual investors, have some degree of sway over Matrix IT. This size of ownership, while considerable, may not be enough to change company policy if the decision is not in sync with other large shareholders.
Public Company Ownership
Public companies currently own 48% of Matrix IT stock. We can't be certain but it is quite possible this is a strategic stake. The businesses may be similar, or work together.
Next Steps:
I find it very interesting to look at who exactly owns a company. But to truly gain insight, we need to consider other information, too.
I like to dive deeper into how a company has performed in the past. You can access this interactive graph of past earnings, revenue and cash flow, for free.
Ultimately the future is most important. You can access this free report on analyst forecasts for the company.
NB: Figures in this article are calculated using data from the last twelve months, which refer to the 12-month period ending on the last date of the month the financial statement is dated. This may not be consistent with full year annual report figures.
Have feedback on this article? Concerned about the content? Get in touch with us directly. Alternatively, email editorial-team (at) simplywallst.com.
This article by Simply Wall St is general in nature. We provide commentary based on historical data and analyst forecasts only using an unbiased methodology and our articles are not intended to be financial advice. It does not constitute a recommendation to buy or sell any stock, and does not take account of your objectives, or your financial situation. We aim to bring you long-term focused analysis driven by fundamental data. Note that our analysis may not factor in the latest price-sensitive company announcements or qualitative material. Simply Wall St has no position in any stocks mentioned.