
- LIVE QUOTES
- LEARN
- HELP
 Nasdaq
 Wall Street Journal
EN
Middle Eastern Penny Stocks To Watch In January 2026
The Middle Eastern stock markets have shown a mixed performance recently, with Egypt's bourse outpacing its Gulf counterparts in 2025, while oil prices weighed on Saudi Arabia's market. In this context, penny stocks—though an outdated term—continue to attract attention for their potential to offer growth at lower price points. By focusing on companies with strong financials and solid fundamentals, investors can explore opportunities that may provide both stability and potential upside in the evolving market landscape.
Top 10 Penny Stocks In The Middle East
| Name | Share Price | Market Cap | Rewards & Risks |
| Thob Al Aseel (SASE:4012) | SAR3.35 | SAR1.35B | ✅ 2 ⚠️ 1 View Analysis > |
| Alarum Technologies (TASE:ALAR) | ₪2.811 | ₪201.59M | ✅ 2 ⚠️ 3 View Analysis > |
| E7 Group PJSC (ADX:E7) | AED1.04 | AED2.18B | ✅ 3 ⚠️ 2 View Analysis > |
| Sharjah Insurance Company P.S.C (ADX:SICO) | AED1.52 | AED228M | ✅ 2 ⚠️ 2 View Analysis > |
| Al Wathba National Insurance Company PJSC (ADX:AWNIC) | AED3.50 | AED724.5M | ✅ 2 ⚠️ 3 View Analysis > |
| Arabian Pipes (SASE:2200) | SAR4.70 | SAR946M | ✅ 3 ⚠️ 0 View Analysis > |
| Dubai National Insurance & Reinsurance (P.S.C.) (DFM:DNIR) | AED3.25 | AED384.62M | ✅ 2 ⚠️ 4 View Analysis > |
| Dubai Investments PJSC (DFM:DIC) | AED3.57 | AED15.22B | ✅ 2 ⚠️ 3 View Analysis > |
| Sharjah Cement and Industrial Development (PJSC) (ADX:SCIDC) | AED0.829 | AED504.24M | ✅ 2 ⚠️ 1 View Analysis > |
| Tgi Infrastructures (TASE:TGI) | ₪2.532 | ₪198.76M | ✅ 2 ⚠️ 2 View Analysis > |
Click here to see the full list of 80 stocks from our Middle Eastern Penny Stocks screener.
Here we highlight a subset of our preferred stocks from the screener.
Sanica Isi Sanayi (IBSE:SNICA)
Simply Wall St Financial Health Rating: ★★★★★★
Overview: Sanica Isi Sanayi A.S. operates in Türkiye, producing and selling radiators, towel warmers, boilers, built-in reservoirs, control panels, and pipes with a market cap of TRY2.56 billion.
Operations: The company's revenue from Building Products totals TRY2.51 billion.
Market Cap: TRY2.56B
Sanica Isi Sanayi A.S. operates with a market cap of TRY2.56 billion and has reported revenues from Building Products totaling TRY2.51 billion, indicating it's not pre-revenue. Despite this, the company is currently unprofitable with increasing losses over the past five years at a rate of 44% per year. However, its short-term assets (TRY4.2B) comfortably cover both short-term (TRY2.9B) and long-term liabilities (TRY1B), suggesting financial stability in asset management despite profitability challenges. Recent earnings announcements show increased sales but also highlight significant net losses compared to previous profits, reflecting ongoing operational struggles amidst revenue growth efforts.
- Take a closer look at Sanica Isi Sanayi's potential here in our financial health report.
- Gain insights into Sanica Isi Sanayi's historical outcomes by reviewing our past performance report.

Bram Industries (TASE:BRAM)
Simply Wall St Financial Health Rating: ★★★★★☆
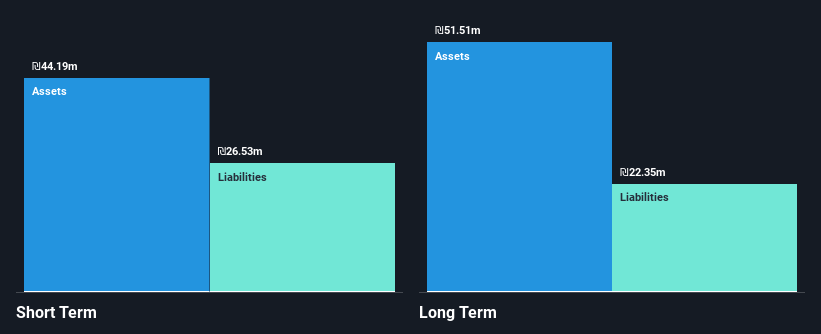
Overview: Bram Industries Ltd. operates in Israel through its subsidiaries, focusing on the development, production, and marketing of plastic products using injection-molding technology, with a market cap of ₪22.11 million.
Operations: Bram Industries generates revenue primarily from its Packaging for the Food Industry segment, which accounts for ₪53.81 million, and a smaller contribution from Home Essentials Products - Plastic Products at ₪0.52 million.
Market Cap: ₪22.11M
Bram Industries Ltd., with a market cap of ₪22.11 million, primarily generates revenue from its Packaging for the Food Industry segment. Despite being unprofitable, the company has reduced its net loss significantly over recent periods and improved its debt to equity ratio from 74.6% to 34.8% over five years, indicating effective debt management. Short-term assets exceed both short-term and long-term liabilities, suggesting a stable financial position despite volatile share prices and declining earnings over the past five years at an annual rate of 14.4%. The board is experienced with an average tenure of 4.8 years.
- Navigate through the intricacies of Bram Industries with our comprehensive balance sheet health report here.
- Examine Bram Industries' past performance report to understand how it has performed in prior years.
Utron (TASE:UTRN)
Simply Wall St Financial Health Rating: ★★★★★★
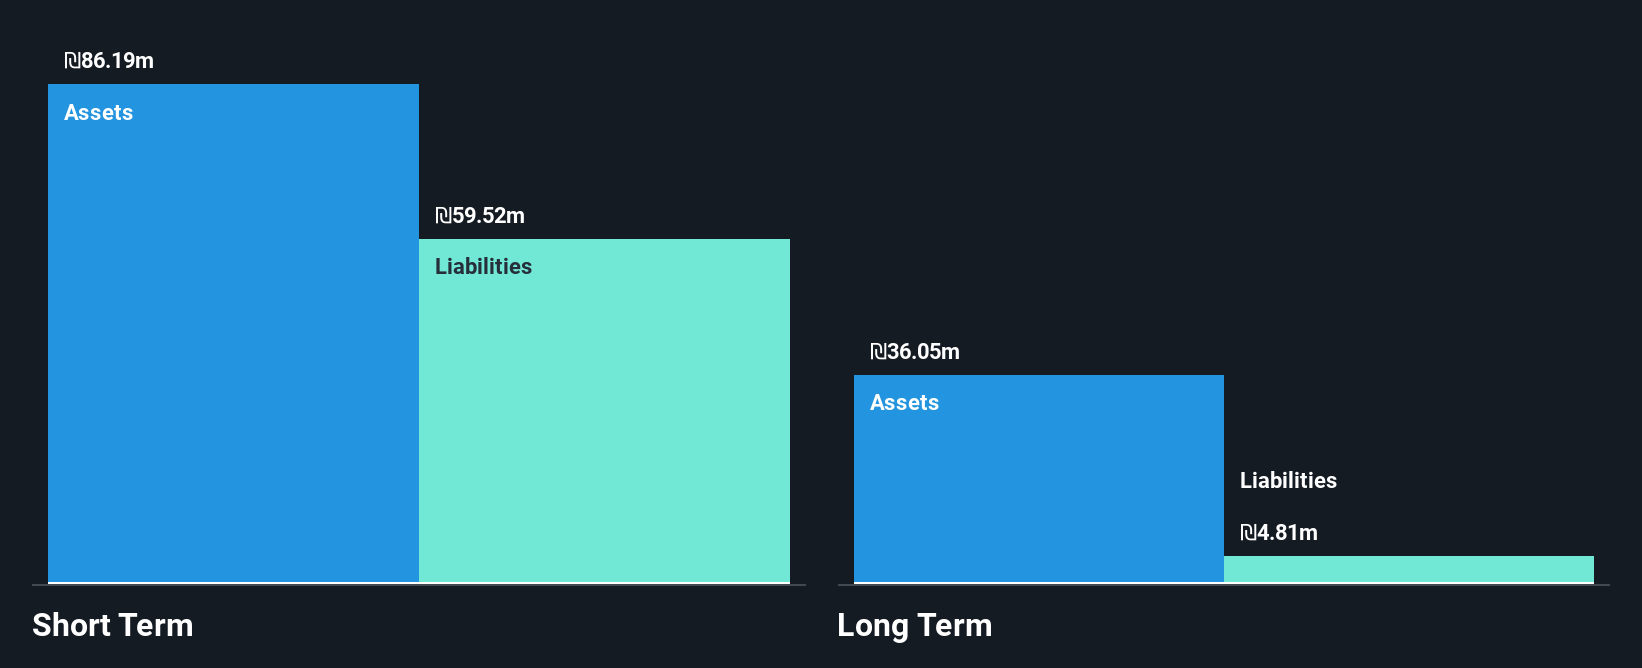
Overview: Utron Ltd specializes in the planning, development, production, construction, marketing, and maintenance of autonomous parking solutions and has a market cap of ₪94.09 million.
Operations: The company's revenue from the heavy construction segment is ₪101.91 million.
Market Cap: ₪94.09M
Utron Ltd., with a market cap of ₪94.09 million, is trading significantly below its estimated fair value, indicating potential undervaluation. The company has demonstrated robust earnings growth of 71.6% over the past year, surpassing industry averages and highlighting strong operational performance. Utron's financial health is solid with short-term assets exceeding liabilities and more cash than total debt, ensuring liquidity stability. Its debt-to-equity ratio has improved to 9.4%, reflecting prudent financial management. However, despite high-quality earnings and experienced leadership, the return on equity remains low at 2.6%, which could be a concern for some investors seeking higher returns.
- Get an in-depth perspective on Utron's performance by reading our balance sheet health report here.
- Explore historical data to track Utron's performance over time in our past results report.
Turning Ideas Into Actions
- Navigate through the entire inventory of 80 Middle Eastern Penny Stocks here.
- Searching for a Fresh Perspective? Find companies with promising cash flow potential yet trading below their fair value.
This article by Simply Wall St is general in nature. We provide commentary based on historical data and analyst forecasts only using an unbiased methodology and our articles are not intended to be financial advice. It does not constitute a recommendation to buy or sell any stock, and does not take account of your objectives, or your financial situation. We aim to bring you long-term focused analysis driven by fundamental data. Note that our analysis may not factor in the latest price-sensitive company announcements or qualitative material. Simply Wall St has no position in any stocks mentioned.
Have feedback on this article? Concerned about the content? Get in touch with us directly. Alternatively, email editorial-team@simplywallst.com