
- LIVE QUOTES
- LEARN
- HELP
 Nasdaq
 Wall Street Journal
EN
S P Setia Berhad's (KLSE:SPSETIA) recent 6.4% pullback adds to one-year year losses, institutional owners may take drastic measures
Key Insights
- Institutions' substantial holdings in S P Setia Berhad implies that they have significant influence over the company's share price
- A total of 2 investors have a majority stake in the company with 58% ownership
- Using data from analyst forecasts alongside ownership research, one can better assess the future performance of a company
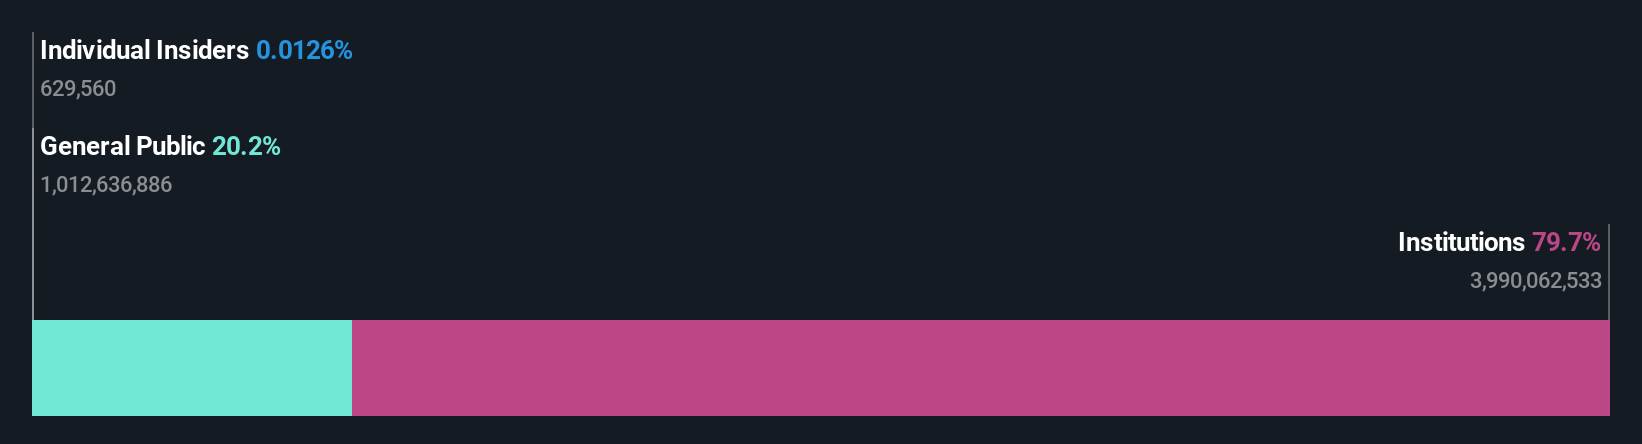
A look at the shareholders of S P Setia Berhad (KLSE:SPSETIA) can tell us which group is most powerful. And the group that holds the biggest piece of the pie are institutions with 80% ownership. In other words, the group stands to gain the most (or lose the most) from their investment into the company.
As a result, institutional investors endured the highest losses last week after market cap fell by RM250m. This set of investors may especially be concerned about the current loss, which adds to a one-year loss of 48% for shareholders. Institutions or "liquidity providers" control large sums of money and therefore, these types of investors usually have a lot of influence over stock price movements. As a result, if the downtrend continues, institutions may face pressures to sell S P Setia Berhad, which might have negative implications on individual investors.
Let's take a closer look to see what the different types of shareholders can tell us about S P Setia Berhad.
Check out our latest analysis for S P Setia Berhad
What Does The Institutional Ownership Tell Us About S P Setia Berhad?
Many institutions measure their performance against an index that approximates the local market. So they usually pay more attention to companies that are included in major indices.
As you can see, institutional investors have a fair amount of stake in S P Setia Berhad. This suggests some credibility amongst professional investors. But we can't rely on that fact alone since institutions make bad investments sometimes, just like everyone does. When multiple institutions own a stock, there's always a risk that they are in a 'crowded trade'. When such a trade goes wrong, multiple parties may compete to sell stock fast. This risk is higher in a company without a history of growth. You can see S P Setia Berhad's historic earnings and revenue below, but keep in mind there's always more to the story.

Since institutional investors own more than half the issued stock, the board will likely have to pay attention to their preferences. S P Setia Berhad is not owned by hedge funds. Permodalan Nasional Berhad is currently the largest shareholder, with 49% of shares outstanding. With 9.0% and 8.3% of the shares outstanding respectively, Employees Provident Fund of Malaysia and Kumpulan Wang Persaraan are the second and third largest shareholders.
A more detailed study of the shareholder registry showed us that 2 of the top shareholders have a considerable amount of ownership in the company, via their 58% stake.
Researching institutional ownership is a good way to gauge and filter a stock's expected performance. The same can be achieved by studying analyst sentiments. There are plenty of analysts covering the stock, so it might be worth seeing what they are forecasting, too.
Insider Ownership Of S P Setia Berhad
The definition of an insider can differ slightly between different countries, but members of the board of directors always count. Management ultimately answers to the board. However, it is not uncommon for managers to be executive board members, especially if they are a founder or the CEO.
Most consider insider ownership a positive because it can indicate the board is well aligned with other shareholders. However, on some occasions too much power is concentrated within this group.
Our data suggests that insiders own under 1% of S P Setia Berhad in their own names. It has a market capitalization of just RM3.7b, and the board has only RM463k worth of shares in their own names. We generally like to see a board more invested. However it might be worth checking if those insiders have been buying.
General Public Ownership
The general public-- including retail investors -- own 20% stake in the company, and hence can't easily be ignored. While this group can't necessarily call the shots, it can certainly have a real influence on how the company is run.
Next Steps:
I find it very interesting to look at who exactly owns a company. But to truly gain insight, we need to consider other information, too. Case in point: We've spotted 1 warning sign for S P Setia Berhad you should be aware of.
Ultimately the future is most important. You can access this free report on analyst forecasts for the company.
NB: Figures in this article are calculated using data from the last twelve months, which refer to the 12-month period ending on the last date of the month the financial statement is dated. This may not be consistent with full year annual report figures.
Have feedback on this article? Concerned about the content? Get in touch with us directly. Alternatively, email editorial-team (at) simplywallst.com.
This article by Simply Wall St is general in nature. We provide commentary based on historical data and analyst forecasts only using an unbiased methodology and our articles are not intended to be financial advice. It does not constitute a recommendation to buy or sell any stock, and does not take account of your objectives, or your financial situation. We aim to bring you long-term focused analysis driven by fundamental data. Note that our analysis may not factor in the latest price-sensitive company announcements or qualitative material. Simply Wall St has no position in any stocks mentioned.