
- LIVE QUOTES
- LEARN
- HELP
 Nasdaq
 Wall Street Journal
EN
Here's Why Tele2 (STO:TEL2 B) Can Manage Its Debt Responsibly
Warren Buffett famously said, 'Volatility is far from synonymous with risk.' It's only natural to consider a company's balance sheet when you examine how risky it is, since debt is often involved when a business collapses. Importantly, Tele2 AB (publ) (STO:TEL2 B) does carry debt. But is this debt a concern to shareholders?
What Risk Does Debt Bring?
Debt and other liabilities become risky for a business when it cannot easily fulfill those obligations, either with free cash flow or by raising capital at an attractive price. If things get really bad, the lenders can take control of the business. However, a more usual (but still expensive) situation is where a company must dilute shareholders at a cheap share price simply to get debt under control. Of course, the upside of debt is that it often represents cheap capital, especially when it replaces dilution in a company with the ability to reinvest at high rates of return. The first step when considering a company's debt levels is to consider its cash and debt together.
How Much Debt Does Tele2 Carry?
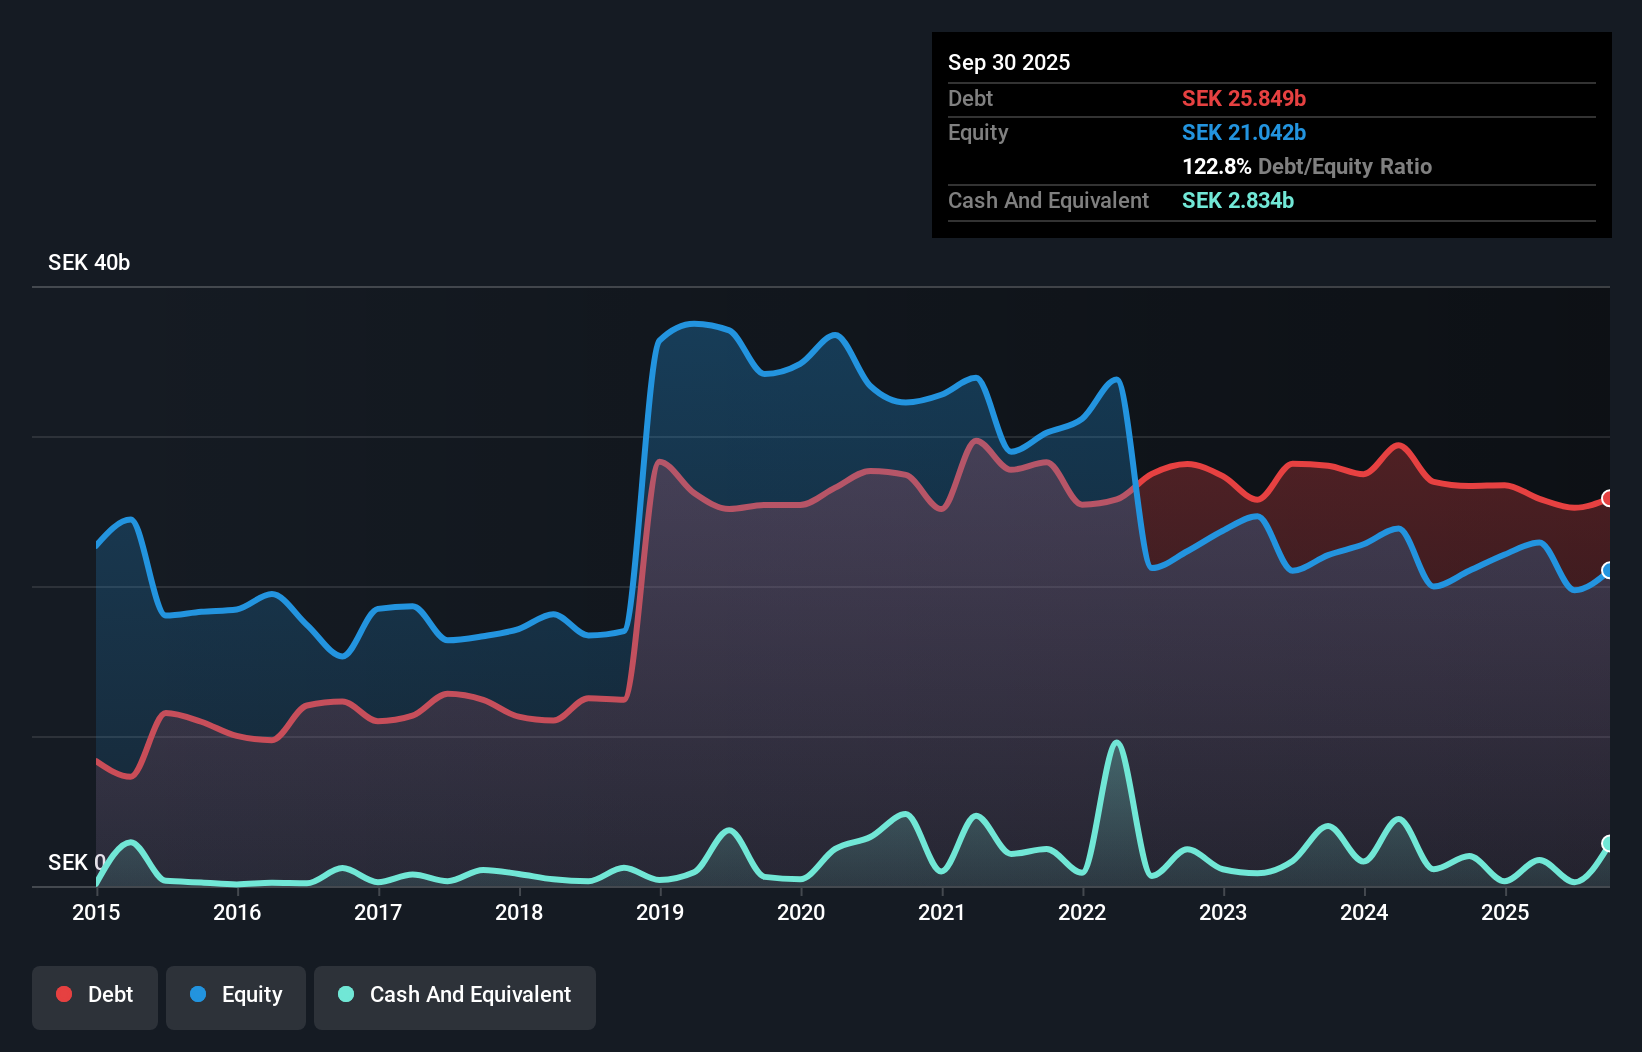
As you can see below, Tele2 had kr25.8b of debt, at September 2025, which is about the same as the year before. You can click the chart for greater detail. On the flip side, it has kr2.83b in cash leading to net debt of about kr23.0b.
How Healthy Is Tele2's Balance Sheet?
According to the last reported balance sheet, Tele2 had liabilities of kr14.3b due within 12 months, and liabilities of kr29.7b due beyond 12 months. On the other hand, it had cash of kr2.83b and kr5.14b worth of receivables due within a year. So it has liabilities totalling kr36.1b more than its cash and near-term receivables, combined.
While this might seem like a lot, it is not so bad since Tele2 has a huge market capitalization of kr106.5b, and so it could probably strengthen its balance sheet by raising capital if it needed to. But we definitely want to keep our eyes open to indications that its debt is bringing too much risk.
Check out our latest analysis for Tele2
We use two main ratios to inform us about debt levels relative to earnings. The first is net debt divided by earnings before interest, tax, depreciation, and amortization (EBITDA), while the second is how many times its earnings before interest and tax (EBIT) covers its interest expense (or its interest cover, for short). This way, we consider both the absolute quantum of the debt, as well as the interest rates paid on it.
Tele2's net debt of 2.0 times EBITDA suggests graceful use of debt. And the alluring interest cover (EBIT of 7.3 times interest expense) certainly does not do anything to dispel this impression. If Tele2 can keep growing EBIT at last year's rate of 13% over the last year, then it will find its debt load easier to manage. When analysing debt levels, the balance sheet is the obvious place to start. But it is future earnings, more than anything, that will determine Tele2's ability to maintain a healthy balance sheet going forward. So if you want to see what the professionals think, you might find this free report on analyst profit forecasts to be interesting.
Finally, a business needs free cash flow to pay off debt; accounting profits just don't cut it. So we clearly need to look at whether that EBIT is leading to corresponding free cash flow. Happily for any shareholders, Tele2 actually produced more free cash flow than EBIT over the last three years. That sort of strong cash conversion gets us as excited as the crowd when the beat drops at a Daft Punk concert.
Our View
Happily, Tele2's impressive conversion of EBIT to free cash flow implies it has the upper hand on its debt. And we also thought its EBIT growth rate was a positive. Taking all this data into account, it seems to us that Tele2 takes a pretty sensible approach to debt. While that brings some risk, it can also enhance returns for shareholders. When analysing debt levels, the balance sheet is the obvious place to start. However, not all investment risk resides within the balance sheet - far from it. We've identified 2 warning signs with Tele2 , and understanding them should be part of your investment process.
When all is said and done, sometimes its easier to focus on companies that don't even need debt. Readers can access a list of growth stocks with zero net debt 100% free, right now.
Have feedback on this article? Concerned about the content? Get in touch with us directly. Alternatively, email editorial-team (at) simplywallst.com.
This article by Simply Wall St is general in nature. We provide commentary based on historical data and analyst forecasts only using an unbiased methodology and our articles are not intended to be financial advice. It does not constitute a recommendation to buy or sell any stock, and does not take account of your objectives, or your financial situation. We aim to bring you long-term focused analysis driven by fundamental data. Note that our analysis may not factor in the latest price-sensitive company announcements or qualitative material. Simply Wall St has no position in any stocks mentioned.