
- LIVE QUOTES
- LEARN
- HELP
 Nasdaq
 Wall Street Journal
EN
ASX Penny Stocks To Watch In December 2025
As the Australian market winds down for the holiday season, it's experiencing a slight dip, likely due to profit-taking as major indices in the U.S. approach record highs. In this context, penny stocks—often small or emerging companies—remain an intriguing investment area due to their affordability and potential for growth. Despite being considered somewhat outdated terminology, these stocks can still offer significant opportunities when backed by solid financials and strategic positioning.
Top 10 Penny Stocks In Australia
| Name | Share Price | Market Cap | Rewards & Risks |
| Alfabs Australia (ASX:AAL) | A$0.405 | A$116.07M | ✅ 4 ⚠️ 4 View Analysis > |
| EZZ Life Science Holdings (ASX:EZZ) | A$1.39 | A$65.57M | ✅ 2 ⚠️ 2 View Analysis > |
| Dusk Group (ASX:DSK) | A$0.78 | A$48.26M | ✅ 4 ⚠️ 2 View Analysis > |
| IVE Group (ASX:IGL) | A$3.00 | A$456.46M | ✅ 4 ⚠️ 2 View Analysis > |
| MotorCycle Holdings (ASX:MTO) | A$3.14 | A$231.93M | ✅ 4 ⚠️ 1 View Analysis > |
| Veris (ASX:VRS) | A$0.074 | A$39.99M | ✅ 3 ⚠️ 2 View Analysis > |
| West African Resources (ASX:WAF) | A$3.14 | A$3.54B | ✅ 4 ⚠️ 2 View Analysis > |
| Service Stream (ASX:SSM) | A$2.26 | A$1.36B | ✅ 3 ⚠️ 2 View Analysis > |
| EDU Holdings (ASX:EDU) | A$0.825 | A$125.22M | ✅ 4 ⚠️ 2 View Analysis > |
| MaxiPARTS (ASX:MXI) | A$2.26 | A$124.98M | ✅ 4 ⚠️ 2 View Analysis > |
Click here to see the full list of 421 stocks from our ASX Penny Stocks screener.
Let's review some notable picks from our screened stocks.
Boss Energy (ASX:BOE)
Simply Wall St Financial Health Rating: ★★★★★★
Overview: Boss Energy Limited engages in the exploration and production of uranium deposits in Australia and the United States, with a market capitalization of A$568.44 million.
Operations: Boss Energy Limited currently does not report any specific revenue segments.
Market Cap: A$568.44M
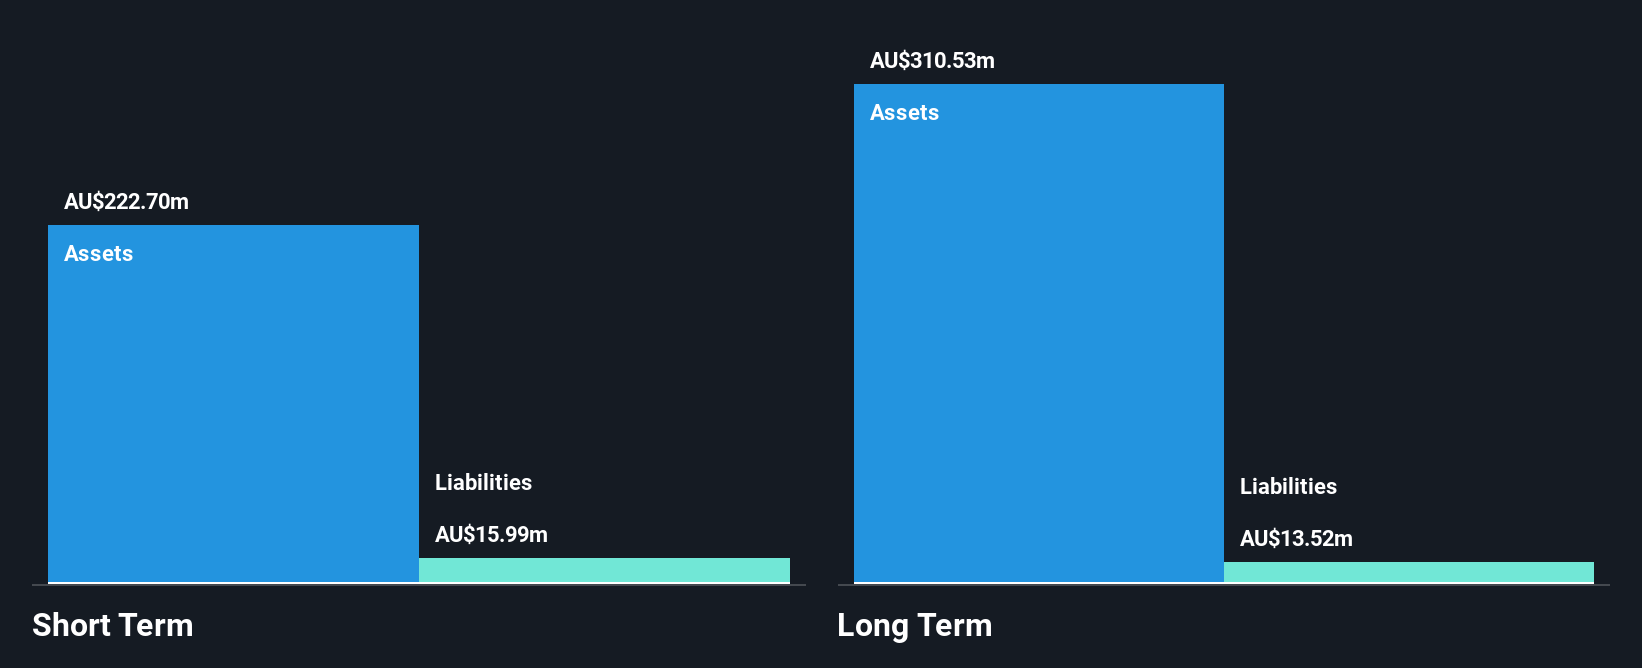
Boss Energy Limited, with a market cap of A$568.44 million, is pre-revenue and currently unprofitable. Despite trading at 70.4% below its estimated fair value, the company faces challenges such as an inexperienced management team and board with average tenures under two years. However, it has maintained stability in weekly volatility over the past year and remains debt-free with short-term assets exceeding both short- and long-term liabilities significantly. Recent events include being dropped from the S&P/ASX 200 Index while undergoing executive changes as Duncan Craib will not rejoin the board in January 2026.
- Get an in-depth perspective on Boss Energy's performance by reading our balance sheet health report here.
- Assess Boss Energy's future earnings estimates with our detailed growth reports.
Fenix Resources (ASX:FEX)
Simply Wall St Financial Health Rating: ★★★★★☆
Overview: Fenix Resources Limited operates in Western Australia, offering mining, logistics, and port services with a market cap of A$357.58 million.
Operations: The company generates revenue of A$316.09 million from its mining operations.
Market Cap: A$357.58M
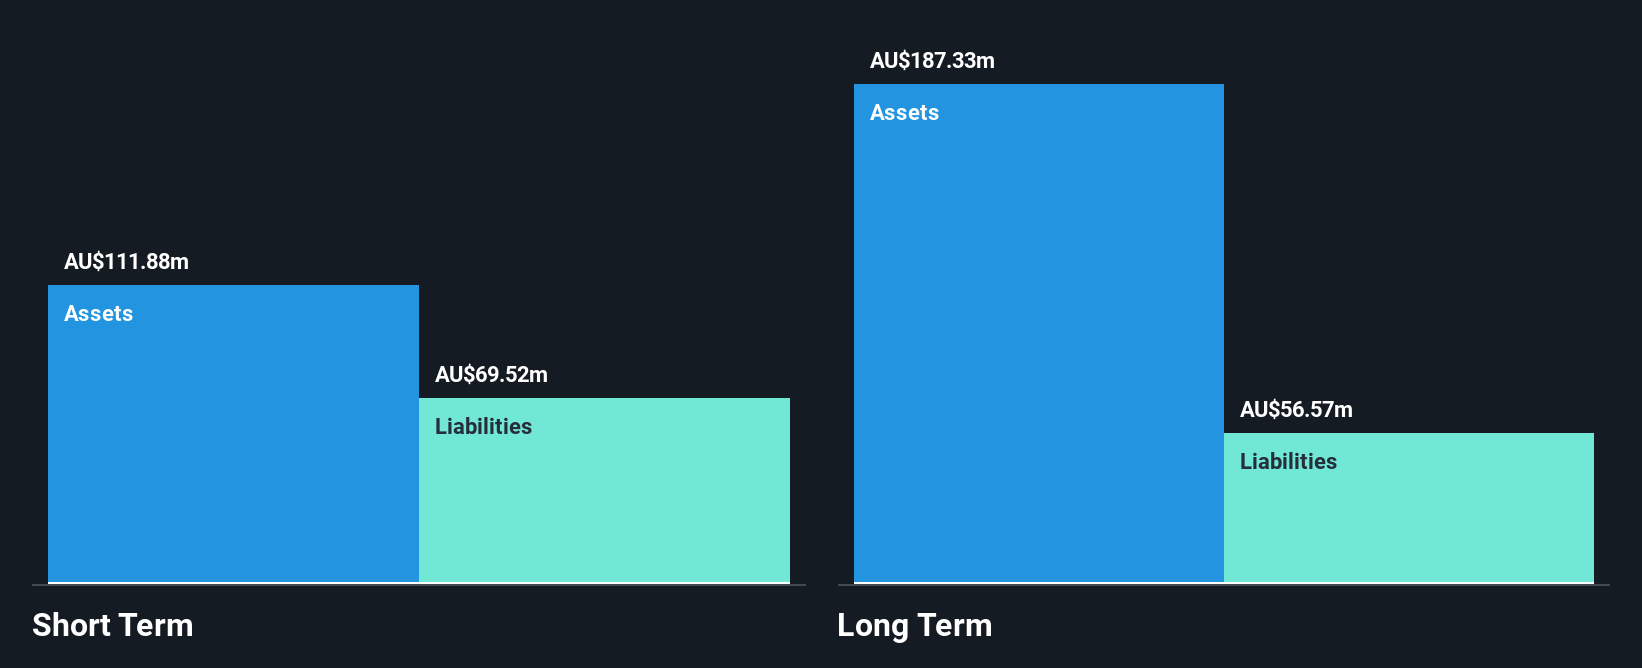
Fenix Resources, with a market cap of A$357.58 million, has shown mixed performance in recent times. The company is profitable but experienced negative earnings growth of 84% over the past year and its net profit margins have decreased to 1.7% from 13%. Despite this, Fenix's short-term assets exceed both short- and long-term liabilities, and it maintains a satisfactory net debt to equity ratio of 9.6%, indicating financial stability. Recent strategic moves include securing iron ore hedging contracts for an additional 240,000 tonnes through December 2026, ensuring positive cashflow margins amidst fluctuating market conditions.
- Click here to discover the nuances of Fenix Resources with our detailed analytical financial health report.
- Review our growth performance report to gain insights into Fenix Resources' future.
GR Engineering Services (ASX:GNG)
Simply Wall St Financial Health Rating: ★★★★★★
Overview: GR Engineering Services Limited offers engineering, process control, automation, and construction services to the mining and mineral processing sectors both in Australia and globally, with a market cap of A$736.78 million.
Operations: The company's revenue is derived from two main segments: Oil and Gas, contributing A$95.93 million, and Mineral Processing, which accounts for A$383.09 million.
Market Cap: A$736.78M
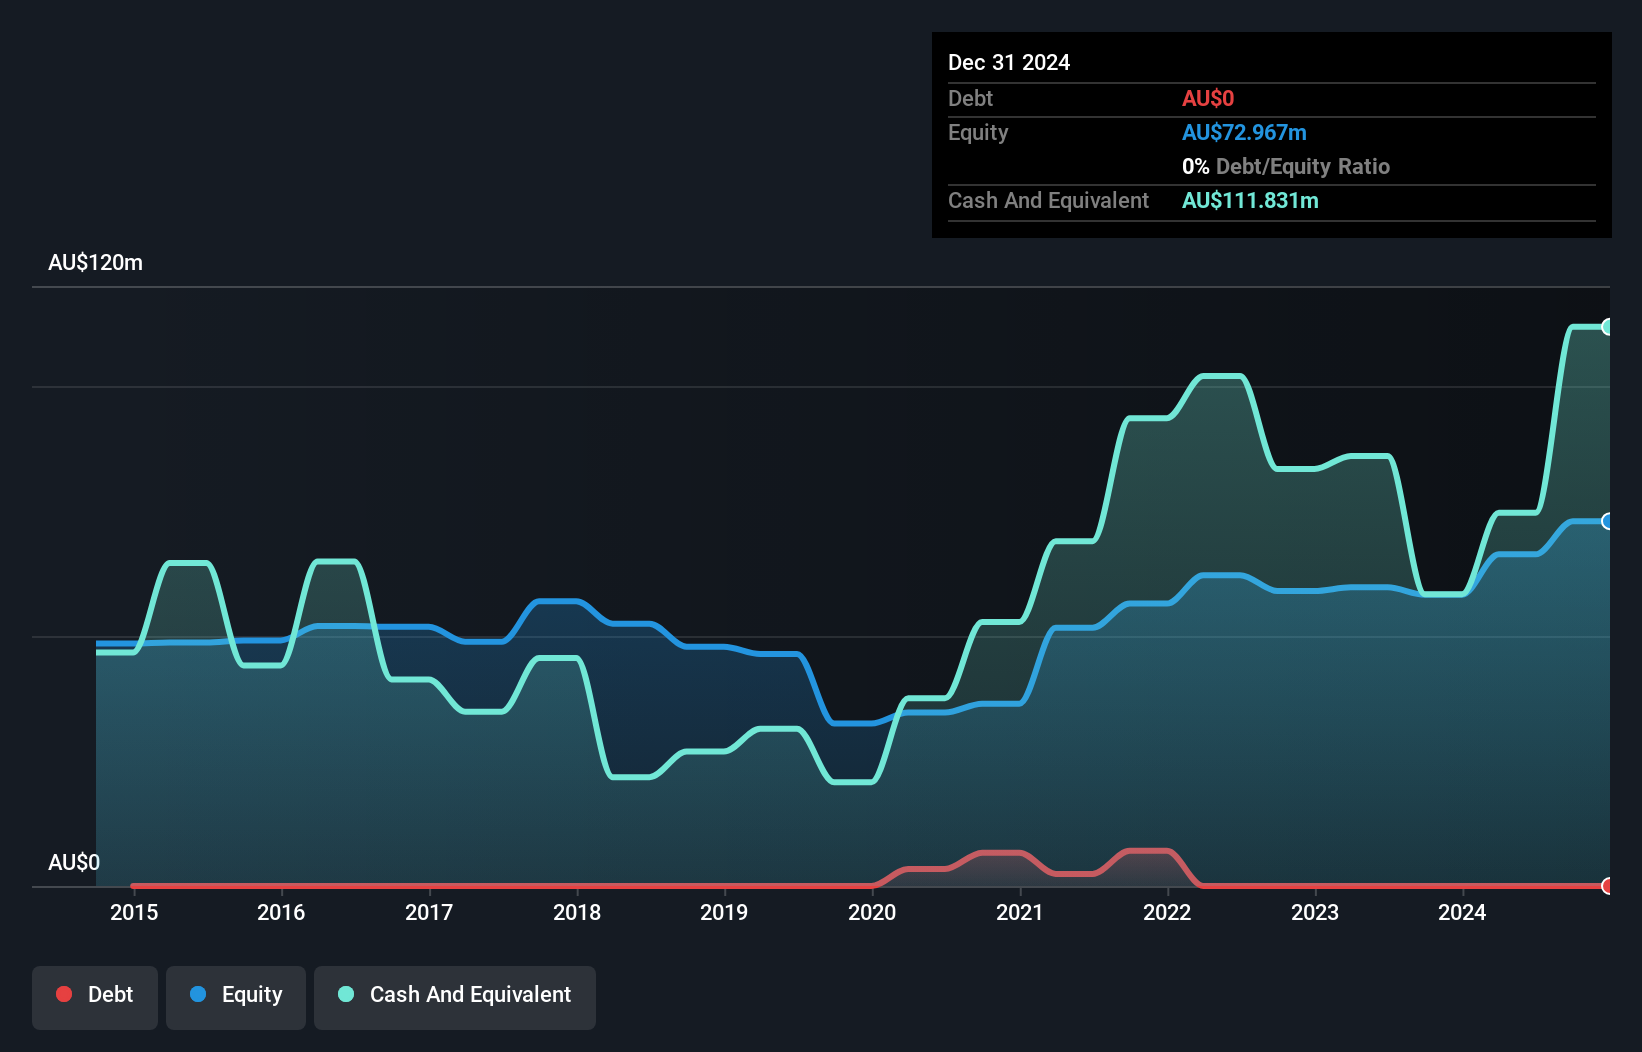
GR Engineering Services, with a market cap of A$736.78 million, presents a mixed picture for investors. The company is debt-free and has experienced significant earnings growth over the past five years at 21.8% annually; however, recent growth slowed to 9.7%, trailing behind industry averages. While its Return on Equity stands out at an impressive 49.7%, net profit margins have slightly declined to 7.1%. Despite trading below estimated fair value by over 40%, the sustainability of its dividend remains questionable due to inadequate coverage by earnings or free cash flows, compounded by recent insider selling activity.
- Dive into the specifics of GR Engineering Services here with our thorough balance sheet health report.
- Gain insights into GR Engineering Services' outlook and expected performance with our report on the company's earnings estimates.
Seize The Opportunity
- Embark on your investment journey to our 421 ASX Penny Stocks selection here.
- Looking For Alternative Opportunities? Find companies with promising cash flow potential yet trading below their fair value.
This article by Simply Wall St is general in nature. We provide commentary based on historical data and analyst forecasts only using an unbiased methodology and our articles are not intended to be financial advice. It does not constitute a recommendation to buy or sell any stock, and does not take account of your objectives, or your financial situation. We aim to bring you long-term focused analysis driven by fundamental data. Note that our analysis may not factor in the latest price-sensitive company announcements or qualitative material. Simply Wall St has no position in any stocks mentioned.
Have feedback on this article? Concerned about the content? Get in touch with us directly. Alternatively, email editorial-team@simplywallst.com