
- LIVE QUOTES
- LEARN
- HELP
 Nasdaq
 Wall Street Journal
EN
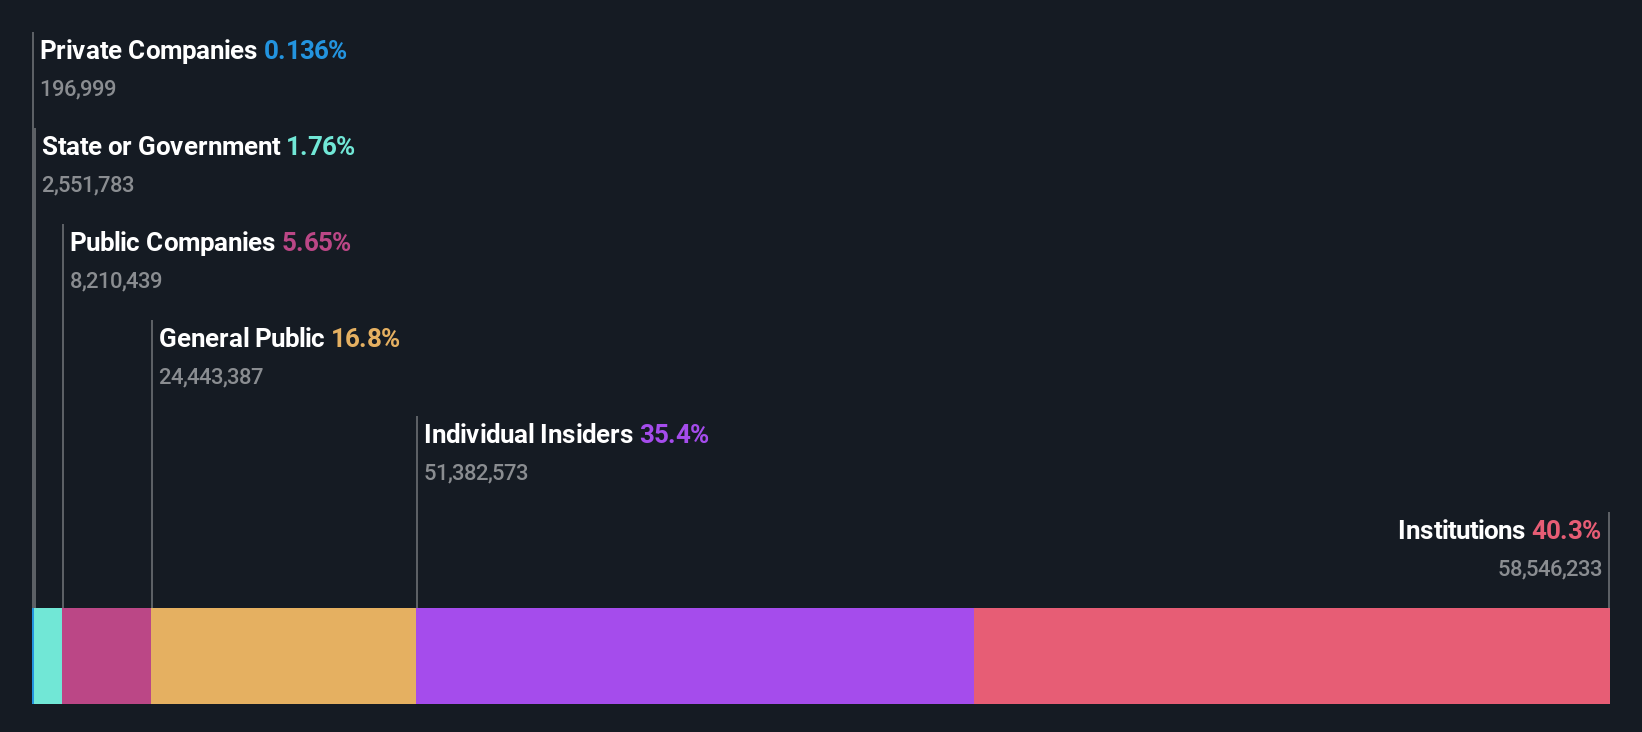
Kirloskar Oil Engines Limited's (NSE:KIRLOSENG) institutional investors lost 6.8% over the past week but have profited from longer-term gains
Key Insights
- Institutions' substantial holdings in Kirloskar Oil Engines implies that they have significant influence over the company's share price
- A total of 6 investors have a majority stake in the company with 52% ownership
- Insider ownership in Kirloskar Oil Engines is 35%
If you want to know who really controls Kirloskar Oil Engines Limited (NSE:KIRLOSENG), then you'll have to look at the makeup of its share registry. And the group that holds the biggest piece of the pie are institutions with 40% ownership. In other words, the group stands to gain the most (or lose the most) from their investment into the company.
Losing money on investments is something no shareholder enjoys, least of all institutional investors who saw their holdings value drop by 6.8% last week. However, the 21% one-year returns may have helped alleviate their overall losses. But they would probably be wary of future losses.
Let's take a closer look to see what the different types of shareholders can tell us about Kirloskar Oil Engines.
See our latest analysis for Kirloskar Oil Engines
What Does The Institutional Ownership Tell Us About Kirloskar Oil Engines?
Many institutions measure their performance against an index that approximates the local market. So they usually pay more attention to companies that are included in major indices.
We can see that Kirloskar Oil Engines does have institutional investors; and they hold a good portion of the company's stock. This implies the analysts working for those institutions have looked at the stock and they like it. But just like anyone else, they could be wrong. It is not uncommon to see a big share price drop if two large institutional investors try to sell out of a stock at the same time. So it is worth checking the past earnings trajectory of Kirloskar Oil Engines, (below). Of course, keep in mind that there are other factors to consider, too.

We note that hedge funds don't have a meaningful investment in Kirloskar Oil Engines. Atul Kirloskar is currently the largest shareholder, with 14% of shares outstanding. With 12% and 7.6% of the shares outstanding respectively, Rahul Kirloskar and DSP BlackRock Investment Managers Pvt. Ltd. are the second and third largest shareholders.
We did some more digging and found that 6 of the top shareholders account for roughly 52% of the register, implying that along with larger shareholders, there are a few smaller shareholders, thereby balancing out each others interests somewhat.
Researching institutional ownership is a good way to gauge and filter a stock's expected performance. The same can be achieved by studying analyst sentiments. There are plenty of analysts covering the stock, so it might be worth seeing what they are forecasting, too.
Insider Ownership Of Kirloskar Oil Engines
The definition of company insiders can be subjective and does vary between jurisdictions. Our data reflects individual insiders, capturing board members at the very least. Company management run the business, but the CEO will answer to the board, even if he or she is a member of it.
I generally consider insider ownership to be a good thing. However, on some occasions it makes it more difficult for other shareholders to hold the board accountable for decisions.
It seems insiders own a significant proportion of Kirloskar Oil Engines Limited. It is very interesting to see that insiders have a meaningful ₹63b stake in this ₹178b business. Most would be pleased to see the board is investing alongside them. You may wish to access this free chart showing recent trading by insiders.
General Public Ownership
With a 17% ownership, the general public, mostly comprising of individual investors, have some degree of sway over Kirloskar Oil Engines. While this size of ownership may not be enough to sway a policy decision in their favour, they can still make a collective impact on company policies.
Public Company Ownership
It appears to us that public companies own 5.6% of Kirloskar Oil Engines. We can't be certain but it is quite possible this is a strategic stake. The businesses may be similar, or work together.
Next Steps:
It's always worth thinking about the different groups who own shares in a company. But to understand Kirloskar Oil Engines better, we need to consider many other factors. To that end, you should learn about the 2 warning signs we've spotted with Kirloskar Oil Engines (including 1 which shouldn't be ignored) .
If you would prefer discover what analysts are predicting in terms of future growth, do not miss this free report on analyst forecasts.
NB: Figures in this article are calculated using data from the last twelve months, which refer to the 12-month period ending on the last date of the month the financial statement is dated. This may not be consistent with full year annual report figures.
Have feedback on this article? Concerned about the content? Get in touch with us directly. Alternatively, email editorial-team (at) simplywallst.com.
This article by Simply Wall St is general in nature. We provide commentary based on historical data and analyst forecasts only using an unbiased methodology and our articles are not intended to be financial advice. It does not constitute a recommendation to buy or sell any stock, and does not take account of your objectives, or your financial situation. We aim to bring you long-term focused analysis driven by fundamental data. Note that our analysis may not factor in the latest price-sensitive company announcements or qualitative material. Simply Wall St has no position in any stocks mentioned.