
- LIVE QUOTES
- LEARN
- HELP
 Nasdaq
 Wall Street Journal
EN
Estimating The Intrinsic Value Of Pak Tak International Limited (HKG:2668)
Key Insights
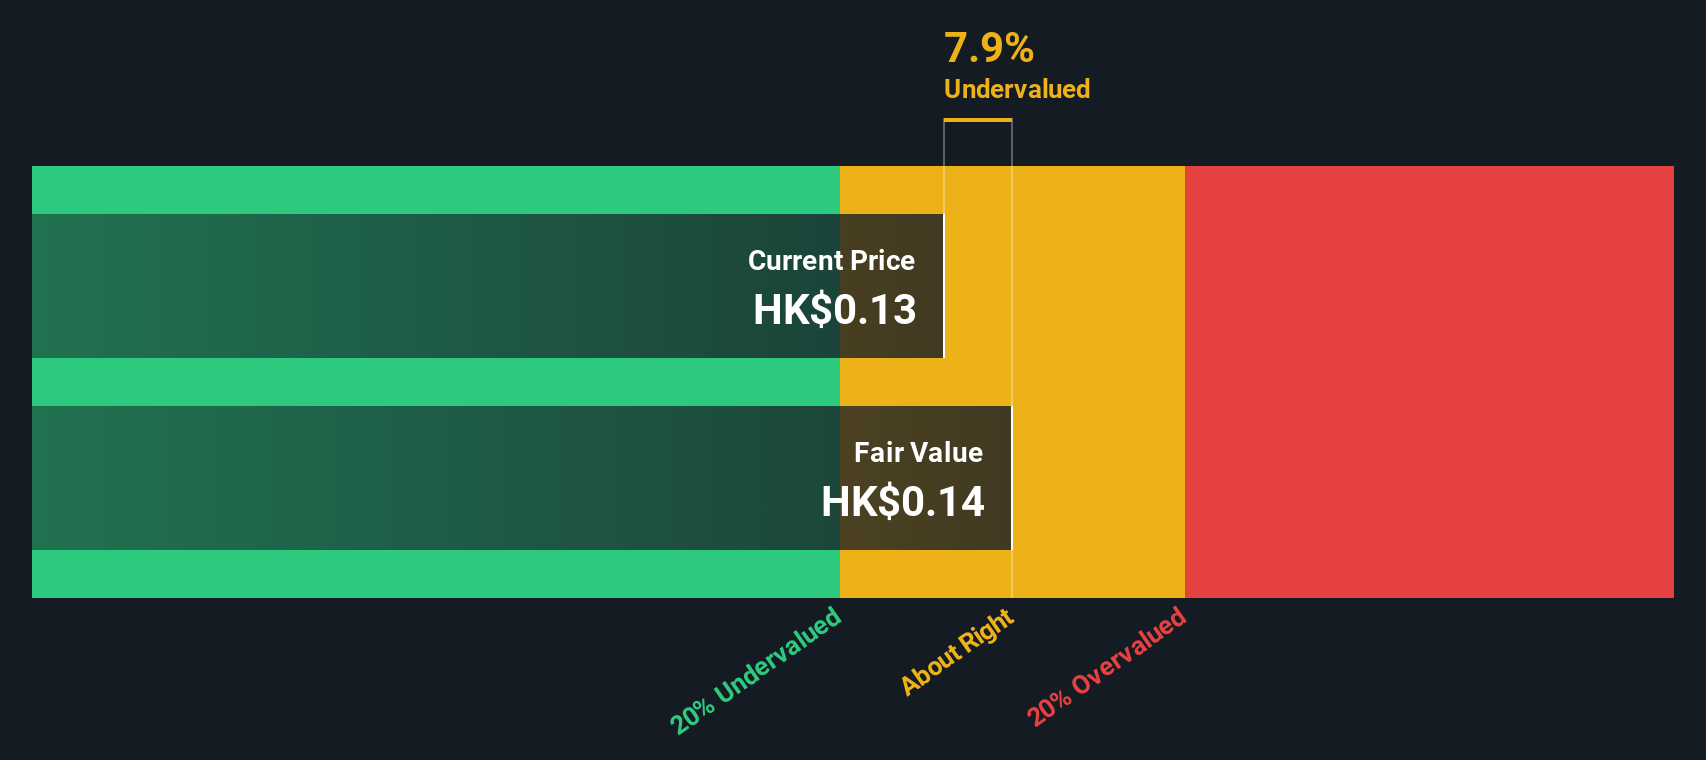
- The projected fair value for Pak Tak International is HK$0.14 based on 2 Stage Free Cash Flow to Equity
- With HK$0.13 share price, Pak Tak International appears to be trading close to its estimated fair value
- Pak Tak International's peers seem to be trading at a lower discount to fair value based onthe industry average of 3.8%
Does the December share price for Pak Tak International Limited (HKG:2668) reflect what it's really worth? Today, we will estimate the stock's intrinsic value by estimating the company's future cash flows and discounting them to their present value. This will be done using the Discounted Cash Flow (DCF) model. Models like these may appear beyond the comprehension of a lay person, but they're fairly easy to follow.
Companies can be valued in a lot of ways, so we would point out that a DCF is not perfect for every situation. If you want to learn more about discounted cash flow, the rationale behind this calculation can be read in detail in the Simply Wall St analysis model.
The Model
We use what is known as a 2-stage model, which simply means we have two different periods of growth rates for the company's cash flows. Generally the first stage is higher growth, and the second stage is a lower growth phase. In the first stage we need to estimate the cash flows to the business over the next ten years. Seeing as no analyst estimates of free cash flow are available to us, we have extrapolate the previous free cash flow (FCF) from the company's last reported value. We assume companies with shrinking free cash flow will slow their rate of shrinkage, and that companies with growing free cash flow will see their growth rate slow, over this period. We do this to reflect that growth tends to slow more in the early years than it does in later years.
Generally we assume that a dollar today is more valuable than a dollar in the future, and so the sum of these future cash flows is then discounted to today's value:
10-year free cash flow (FCF) estimate
| 2026 | 2027 | 2028 | 2029 | 2030 | 2031 | 2032 | 2033 | 2034 | 2035 | |
| Levered FCF (HK$, Millions) | HK$67.6m | HK$71.2m | HK$74.5m | HK$77.4m | HK$80.3m | HK$83.0m | HK$85.7m | HK$88.4m | HK$91.0m | HK$93.7m |
| Growth Rate Estimate Source | Est @ 6.33% | Est @ 5.28% | Est @ 4.54% | Est @ 4.02% | Est @ 3.66% | Est @ 3.41% | Est @ 3.23% | Est @ 3.11% | Est @ 3.02% | Est @ 2.96% |
| Present Value (HK$, Millions) Discounted @ 12% | HK$60.4 | HK$56.8 | HK$53.1 | HK$49.3 | HK$45.7 | HK$42.2 | HK$38.9 | HK$35.9 | HK$33.0 | HK$30.4 |
("Est" = FCF growth rate estimated by Simply Wall St)
Present Value of 10-year Cash Flow (PVCF) = HK$446m
We now need to calculate the Terminal Value, which accounts for all the future cash flows after this ten year period. For a number of reasons a very conservative growth rate is used that cannot exceed that of a country's GDP growth. In this case we have used the 5-year average of the 10-year government bond yield (2.8%) to estimate future growth. In the same way as with the 10-year 'growth' period, we discount future cash flows to today's value, using a cost of equity of 12%.
Terminal Value (TV)= FCF2035 × (1 + g) ÷ (r – g) = HK$94m× (1 + 2.8%) ÷ (12%– 2.8%) = HK$1.1b
Present Value of Terminal Value (PVTV)= TV / (1 + r)10= HK$1.1b÷ ( 1 + 12%)10= HK$343m
The total value, or equity value, is then the sum of the present value of the future cash flows, which in this case is HK$789m. To get the intrinsic value per share, we divide this by the total number of shares outstanding. Relative to the current share price of HK$0.1, the company appears about fair value at a 7.9% discount to where the stock price trades currently. Valuations are imprecise instruments though, rather like a telescope - move a few degrees and end up in a different galaxy. Do keep this in mind.
The Assumptions
Now the most important inputs to a discounted cash flow are the discount rate, and of course, the actual cash flows. Part of investing is coming up with your own evaluation of a company's future performance, so try the calculation yourself and check your own assumptions. The DCF also does not consider the possible cyclicality of an industry, or a company's future capital requirements, so it does not give a full picture of a company's potential performance. Given that we are looking at Pak Tak International as potential shareholders, the cost of equity is used as the discount rate, rather than the cost of capital (or weighted average cost of capital, WACC) which accounts for debt. In this calculation we've used 12%, which is based on a levered beta of 1.786. Beta is a measure of a stock's volatility, compared to the market as a whole. We get our beta from the industry average beta of globally comparable companies, with an imposed limit between 0.8 and 2.0, which is a reasonable range for a stable business.
Check out our latest analysis for Pak Tak International
SWOT Analysis for Pak Tak International
- No major strengths identified for 2668.
- Shareholders have been diluted in the past year.
- Has sufficient cash runway for more than 3 years based on current free cash flows.
- Current share price is below our estimate of fair value.
- Lack of analyst coverage makes it difficult to determine 2668's earnings prospects.
- Debt is not well covered by operating cash flow.
Next Steps:
Valuation is only one side of the coin in terms of building your investment thesis, and it ideally won't be the sole piece of analysis you scrutinize for a company. The DCF model is not a perfect stock valuation tool. Rather it should be seen as a guide to "what assumptions need to be true for this stock to be under/overvalued?" If a company grows at a different rate, or if its cost of equity or risk free rate changes sharply, the output can look very different. For Pak Tak International, there are three pertinent elements you should further examine:
- Risks: Take risks, for example - Pak Tak International has 4 warning signs (and 2 which are significant) we think you should know about.
- Other High Quality Alternatives: Do you like a good all-rounder? Explore our interactive list of high quality stocks to get an idea of what else is out there you may be missing!
- Other Top Analyst Picks: Interested to see what the analysts are thinking? Take a look at our interactive list of analysts' top stock picks to find out what they feel might have an attractive future outlook!
PS. Simply Wall St updates its DCF calculation for every Hong Kong stock every day, so if you want to find the intrinsic value of any other stock just search here.
Have feedback on this article? Concerned about the content? Get in touch with us directly. Alternatively, email editorial-team (at) simplywallst.com.
This article by Simply Wall St is general in nature. We provide commentary based on historical data and analyst forecasts only using an unbiased methodology and our articles are not intended to be financial advice. It does not constitute a recommendation to buy or sell any stock, and does not take account of your objectives, or your financial situation. We aim to bring you long-term focused analysis driven by fundamental data. Note that our analysis may not factor in the latest price-sensitive company announcements or qualitative material. Simply Wall St has no position in any stocks mentioned.