
- LIVE QUOTES
- LEARN
- HELP
 Nasdaq
 Wall Street Journal
EN
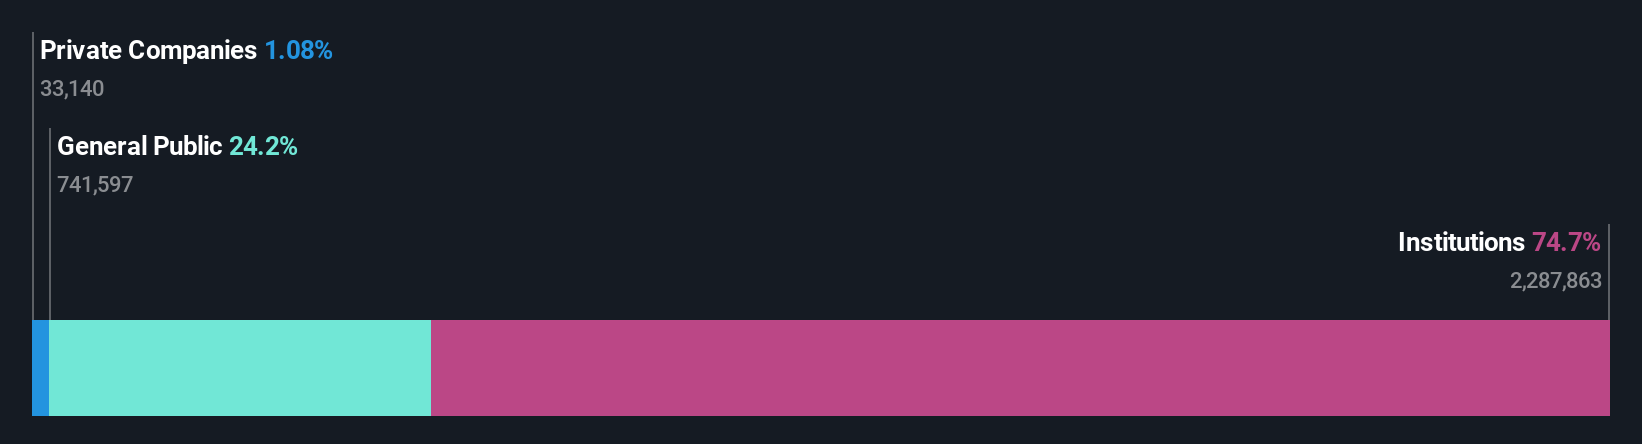
With 75% ownership of the shares, United Urban Investment Corporation (TSE:8960) is heavily dominated by institutional owners
Key Insights
- Significantly high institutional ownership implies United Urban Investment's stock price is sensitive to their trading actions
- The top 10 shareholders own 52% of the company
- Past performance of a company along with ownership data serve to give a strong idea about prospects for a business
To get a sense of who is truly in control of United Urban Investment Corporation (TSE:8960), it is important to understand the ownership structure of the business. And the group that holds the biggest piece of the pie are institutions with 75% ownership. Put another way, the group faces the maximum upside potential (or downside risk).
Because institutional owners have a huge pool of resources and liquidity, their investing decisions tend to carry a great deal of weight, especially with individual investors. Therefore, a good portion of institutional money invested in the company is usually a huge vote of confidence on its future.
Let's take a closer look to see what the different types of shareholders can tell us about United Urban Investment.
Check out our latest analysis for United Urban Investment
What Does The Institutional Ownership Tell Us About United Urban Investment?
Institutions typically measure themselves against a benchmark when reporting to their own investors, so they often become more enthusiastic about a stock once it's included in a major index. We would expect most companies to have some institutions on the register, especially if they are growing.
We can see that United Urban Investment does have institutional investors; and they hold a good portion of the company's stock. This implies the analysts working for those institutions have looked at the stock and they like it. But just like anyone else, they could be wrong. When multiple institutions own a stock, there's always a risk that they are in a 'crowded trade'. When such a trade goes wrong, multiple parties may compete to sell stock fast. This risk is higher in a company without a history of growth. You can see United Urban Investment's historic earnings and revenue below, but keep in mind there's always more to the story.

Investors should note that institutions actually own more than half the company, so they can collectively wield significant power. Hedge funds don't have many shares in United Urban Investment. Bank of Japan is currently the largest shareholder, with 9.4% of shares outstanding. For context, the second largest shareholder holds about 8.2% of the shares outstanding, followed by an ownership of 6.4% by the third-largest shareholder.
On further inspection, we found that more than half the company's shares are owned by the top 10 shareholders, suggesting that the interests of the larger shareholders are balanced out to an extent by the smaller ones.
While it makes sense to study institutional ownership data for a company, it also makes sense to study analyst sentiments to know which way the wind is blowing. There is a little analyst coverage of the stock, but not much. So there is room for it to gain more coverage.
Insider Ownership Of United Urban Investment
The definition of an insider can differ slightly between different countries, but members of the board of directors always count. The company management answer to the board and the latter should represent the interests of shareholders. Notably, sometimes top-level managers are on the board themselves.
Most consider insider ownership a positive because it can indicate the board is well aligned with other shareholders. However, on some occasions too much power is concentrated within this group.
We note our data does not show any board members holding shares, personally. It is unusual not to have at least some personal holdings by board members, so our data might be flawed. A good next step would be to check how much the CEO is paid.
General Public Ownership
With a 24% ownership, the general public, mostly comprising of individual investors, have some degree of sway over United Urban Investment. While this size of ownership may not be enough to sway a policy decision in their favour, they can still make a collective impact on company policies.
Next Steps:
I find it very interesting to look at who exactly owns a company. But to truly gain insight, we need to consider other information, too. Be aware that United Urban Investment is showing 2 warning signs in our investment analysis , and 1 of those is significant...
But ultimately it is the future, not the past, that will determine how well the owners of this business will do. Therefore we think it advisable to take a look at this free report showing whether analysts are predicting a brighter future.
NB: Figures in this article are calculated using data from the last twelve months, which refer to the 12-month period ending on the last date of the month the financial statement is dated. This may not be consistent with full year annual report figures.
Have feedback on this article? Concerned about the content? Get in touch with us directly. Alternatively, email editorial-team (at) simplywallst.com.
This article by Simply Wall St is general in nature. We provide commentary based on historical data and analyst forecasts only using an unbiased methodology and our articles are not intended to be financial advice. It does not constitute a recommendation to buy or sell any stock, and does not take account of your objectives, or your financial situation. We aim to bring you long-term focused analysis driven by fundamental data. Note that our analysis may not factor in the latest price-sensitive company announcements or qualitative material. Simply Wall St has no position in any stocks mentioned.