
- LIVE QUOTES
- LEARN
- HELP
 Nasdaq
 Wall Street Journal
EN
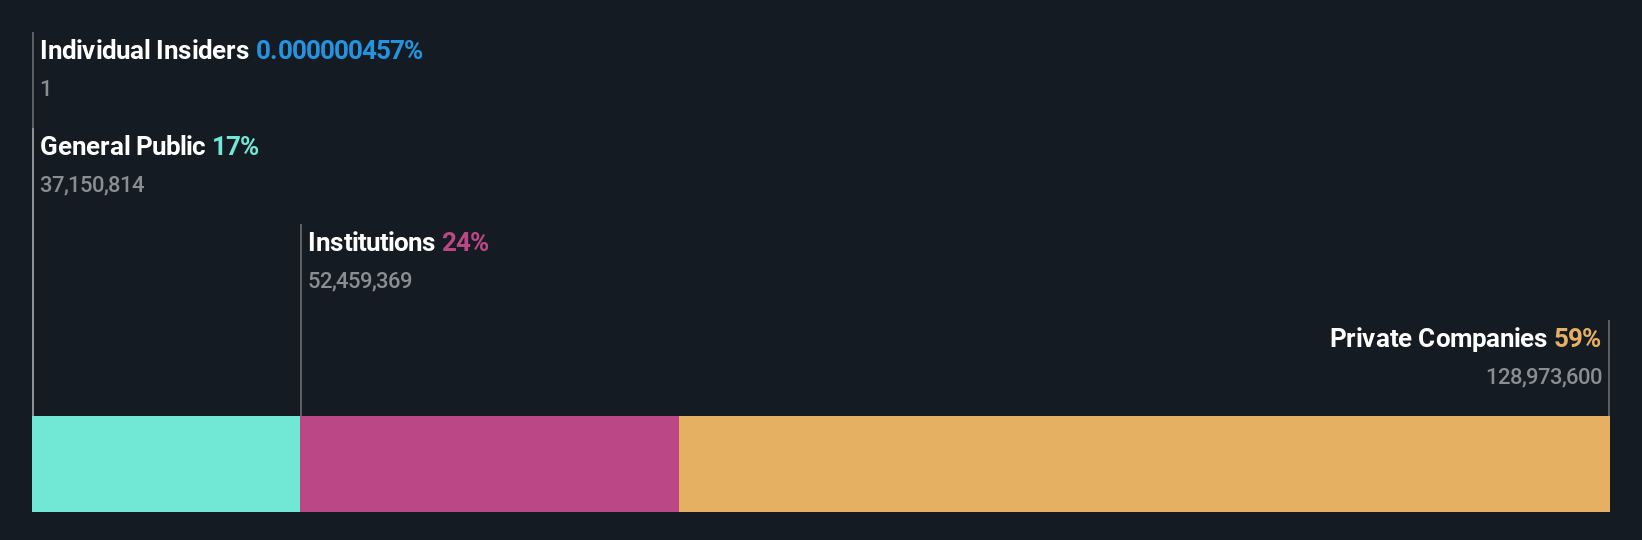
Institutions own 24% of Beiersdorf Aktiengesellschaft (ETR:BEI) shares but private companies control 59% of the company
Key Insights
- Beiersdorf's significant private companies ownership suggests that the key decisions are influenced by shareholders from the larger public
- 59% of the company is held by a single shareholder (Maxingvest GmbH & Co. KGaA)
- Institutions own 24% of Beiersdorf
If you want to know who really controls Beiersdorf Aktiengesellschaft (ETR:BEI), then you'll have to look at the makeup of its share registry. The group holding the most number of shares in the company, around 59% to be precise, is private companies. In other words, the group stands to gain the most (or lose the most) from their investment into the company.
And institutions on the other hand have a 24% ownership in the company. Large companies usually have institutions as shareholders, and we usually see insiders owning shares in smaller companies.
Let's take a closer look to see what the different types of shareholders can tell us about Beiersdorf.
Check out our latest analysis for Beiersdorf
What Does The Institutional Ownership Tell Us About Beiersdorf?
Many institutions measure their performance against an index that approximates the local market. So they usually pay more attention to companies that are included in major indices.
We can see that Beiersdorf does have institutional investors; and they hold a good portion of the company's stock. This can indicate that the company has a certain degree of credibility in the investment community. However, it is best to be wary of relying on the supposed validation that comes with institutional investors. They too, get it wrong sometimes. When multiple institutions own a stock, there's always a risk that they are in a 'crowded trade'. When such a trade goes wrong, multiple parties may compete to sell stock fast. This risk is higher in a company without a history of growth. You can see Beiersdorf's historic earnings and revenue below, but keep in mind there's always more to the story.

Beiersdorf is not owned by hedge funds. Maxingvest GmbH & Co. KGaA is currently the largest shareholder, with 59% of shares outstanding. This essentially means that they have extensive influence, if not outright control, over the future of the corporation. With 3.4% and 3.3% of the shares outstanding respectively, Massachusetts Financial Services Company and BlackRock, Inc. are the second and third largest shareholders.
Researching institutional ownership is a good way to gauge and filter a stock's expected performance. The same can be achieved by studying analyst sentiments. Quite a few analysts cover the stock, so you could look into forecast growth quite easily.
Insider Ownership Of Beiersdorf
The definition of company insiders can be subjective and does vary between jurisdictions. Our data reflects individual insiders, capturing board members at the very least. Management ultimately answers to the board. However, it is not uncommon for managers to be executive board members, especially if they are a founder or the CEO.
I generally consider insider ownership to be a good thing. However, on some occasions it makes it more difficult for other shareholders to hold the board accountable for decisions.
Our information suggests that Beiersdorf Aktiengesellschaft insiders own under 1% of the company. However, it's possible that insiders might have an indirect interest through a more complex structure. It is a very large company, so it would be surprising to see insiders own a large proportion of the company. Though their holding amounts to less than 1%, we can see that board members collectively own €92.6 worth of shares (at current prices). It is always good to see at least some insider ownership, but it might be worth checking if those insiders have been selling.
General Public Ownership
The general public, who are usually individual investors, hold a 17% stake in Beiersdorf. While this group can't necessarily call the shots, it can certainly have a real influence on how the company is run.
Private Company Ownership
Our data indicates that Private Companies hold 59%, of the company's shares. It might be worth looking deeper into this. If related parties, such as insiders, have an interest in one of these private companies, that should be disclosed in the annual report. Private companies may also have a strategic interest in the company.
Next Steps:
I find it very interesting to look at who exactly owns a company. But to truly gain insight, we need to consider other information, too.
Many find it useful to take an in depth look at how a company has performed in the past. You can access this detailed graph of past earnings, revenue and cash flow.
If you would prefer discover what analysts are predicting in terms of future growth, do not miss this free report on analyst forecasts.
NB: Figures in this article are calculated using data from the last twelve months, which refer to the 12-month period ending on the last date of the month the financial statement is dated. This may not be consistent with full year annual report figures.
Have feedback on this article? Concerned about the content? Get in touch with us directly. Alternatively, email editorial-team (at) simplywallst.com.
This article by Simply Wall St is general in nature. We provide commentary based on historical data and analyst forecasts only using an unbiased methodology and our articles are not intended to be financial advice. It does not constitute a recommendation to buy or sell any stock, and does not take account of your objectives, or your financial situation. We aim to bring you long-term focused analysis driven by fundamental data. Note that our analysis may not factor in the latest price-sensitive company announcements or qualitative material. Simply Wall St has no position in any stocks mentioned.