- LIVE QUOTES
- LEARN
- HELP
 Nasdaq
 Wall Street Journal
EN
Guoxin Securities: Buffett's timing effect
The Zhitong Finance App learned that the team of chief economists of the Guoxin Securities Economics Research Institute released a research report saying that as a master investment master, Buffett has gone through many rounds of bull-and-bear cycles and maintained excellent returns. Investment returns are the monetization of cognition, and his investment philosophy is worth studying in depth. After reviewing Buffett's previous position operations, Guoxin Securities summed up three takeaways: first, cash position management is critical to deal with market uncertainty; second, adhering to the value investment concept, bucking the trend and reducing positions when the market is overvalued and bucking the trend to increase positions when undervalued; and third, dare to increase positions when an emergency causes a sharp decline in the market.
First, cash position management is critical in order to cope with market uncertainty. Controlling the cash ratio to fluctuate within a range allows him to take the initiative when the market fluctuates drastically. Buffett can increase his position when the market falls sharply, which stems from having a cash position. Since 2003, Buffett's average cash ratio has been 15.1%, the median is 14.7%, the high level is 20-30%, and the low level is 6-10%.
Second, adhere to the concept of value investment, bucking the trend and reducing positions when the market is overvalued, and bucking the trend and increasing positions when undervalued. Summarizing value investing practiced by investment masters such as Buffett, it generally includes four major elements: buying stocks means buying a company, making good use of Mr. Market, adhering to a sufficient margin of safety, and clarifying one's own circle of competence. The widely spread “fear when others are greedy, greedy when others are afraid” is to make good use of Mr. Market. Looking back at Buffett's actions, it can be seen that when overvalued, he was willing to reduce positions; when underestimated, he was brave enough to increase positions. The change in position was a result.
Third, when an emergency causes a sharp decline in the market, we must dare to increase our positions. When emergencies occur, investor sentiment is affected. The stock market often suddenly plummets, and high-quality companies are mistakenly killed in the short term, providing a rare opportunity to buy good companies at low prices, which requires the courage to act. The stock market often rebounds rapidly after a sharp decline. This is the time to moderately reduce positions and return the cash ratio to normal values.
On November 10, Buffett announced his official retirement at the end of the year in his annual letter to shareholders. As one of the most influential investment masters in the world, Berkshire Hathaway, at its helm, had a cumulative revenue of 5,5022 times and an annualized return of 19.9% from 1965 to 2024, significantly outperforming the S&P 500 cumulative revenue of 390 times and an annualized return of 10.4% during the same period. Buffett is known as a “stock god” because of his long-term excellent compound returns, and his excellent stock selection ability goes without saying. In the past two years, Berkshire's cash holdings have continued to rise, exceeding 30% as of Q3 2025. The stock god's act of reducing positions is worth pondering. This article analyzes Buffett's timing effects through historical data review.
1. Berkshire has clearly added or decreased positions 6 times
To analyze changes in actual stock positions in Berkshire's quarterly balance sheet, the original data needs to be processed. We mainly analyze the two indicators of stock holdings and cash positions. A decrease in the share of increased share+cash holdings means an increase in positions, while a decrease in stock holdings+a rise in the share of cash represents a reduction in positions.
For stock assets, the most explanatory indicator is “actual stock plus or minus positions.” The above stock assets are the original values, and the theoretical stock market value for the current period is estimated based on the rise and fall rate of the S&P 500 index over the same period. The current theoretical stock market value is then subtracted from the actual stock market value disclosed in the current period to obtain the actual stock plus or minus amount for the current period. This indicator can roughly eliminate the impact of stock price fluctuations, thereby capturing Berkshire's active trading behavior.
For cash assets, refer mainly to the “cash on book ratio”. That is, the share of Berkshire cash and cash equivalents in total assets at the end of each quarter. This indicator includes both new capital inflows and outflows from other assets such as stocks.
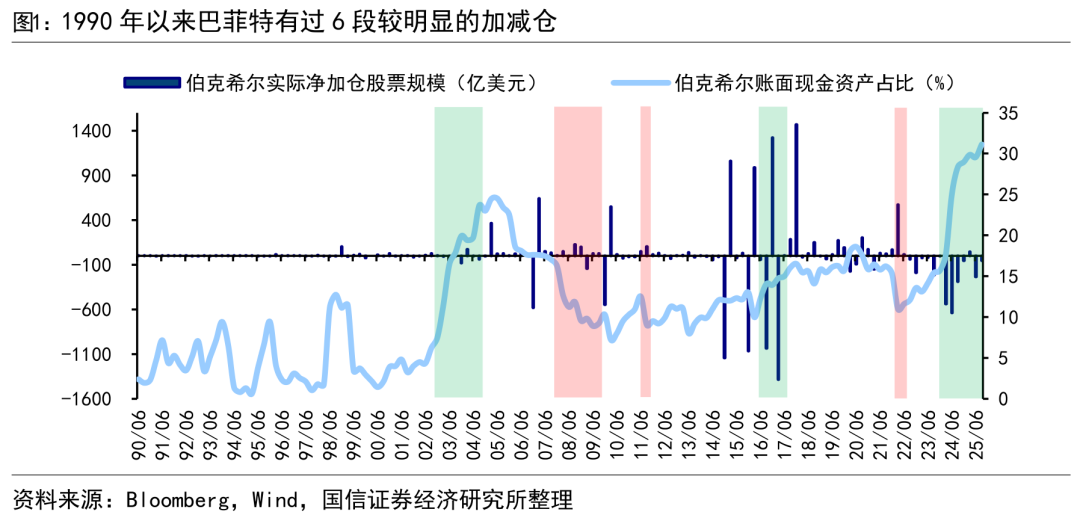
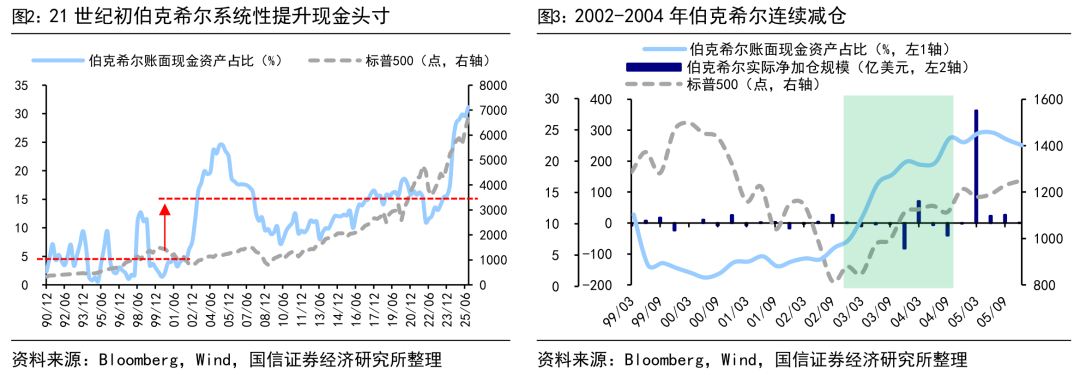
Combining the above two indicators, Buffett has had 6 periods of relatively significant position addition and reduction since 1990. The position increase occurred at 07Q4-09Q3, 11Q3, and 22Q1-22Q2, and the position reduction behavior occurred at 02Q4-04Q3, 16Q2-17Q2, and 24Q1-25Q3.
2. Strategic adjustment of cash positions: 02Q4-04Q3 reduction
After the Internet bubble in the early 21st century, Buffett strategically adjusted his cash position and drastically reduced his positions. From 2002Q4 to 2004Q3, Berkshire continued to reduce its stock holdings. The cumulative actual reduction in positions during this period was about 7.3 billion US dollars. As of the end of 2004, its book stock assets were only about 2.3 billion US dollars. Using this as a dividing point, it can be seen that there has been a systematic increase in Berkshire's cash ratio on book. From 1990 to 2002, Berkshire's average cash ratio was 4.5% and median 3.9%, while in 2003-2025, its average carrying cash ratio rose to 15.1%, with a median of 14.7%.
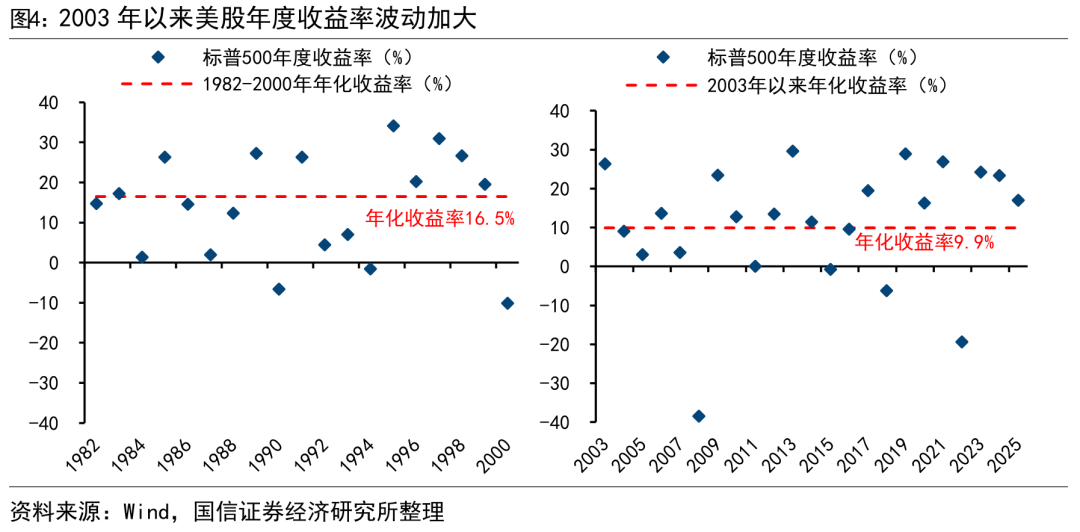
Looking in the rearview mirror: Buffett increased his cash position, which helped to cope with high fluctuations in US stocks in the future. From 1982 to the beginning of 2000, US stocks experienced 18 years of long-term growth. The S&P 500 annualized yield was as high as 16.5%. During this period, it closed down for only 2 years and did not fall by more than 10%. At that time, maintaining a high position was the best strategy. However, after the bursting of the SciNet bubble, the S&P 500 earnings fluctuated markedly. Among them, both fell by more than 20% in 2008 and 2022, as shown in Figure 4. Since 2003, the S&P 500 annualized yield has fallen to 9.9%. In this context, the management of cash positions becomes more important.
3. Open positions when market fears fall: 07Q4-09Q3
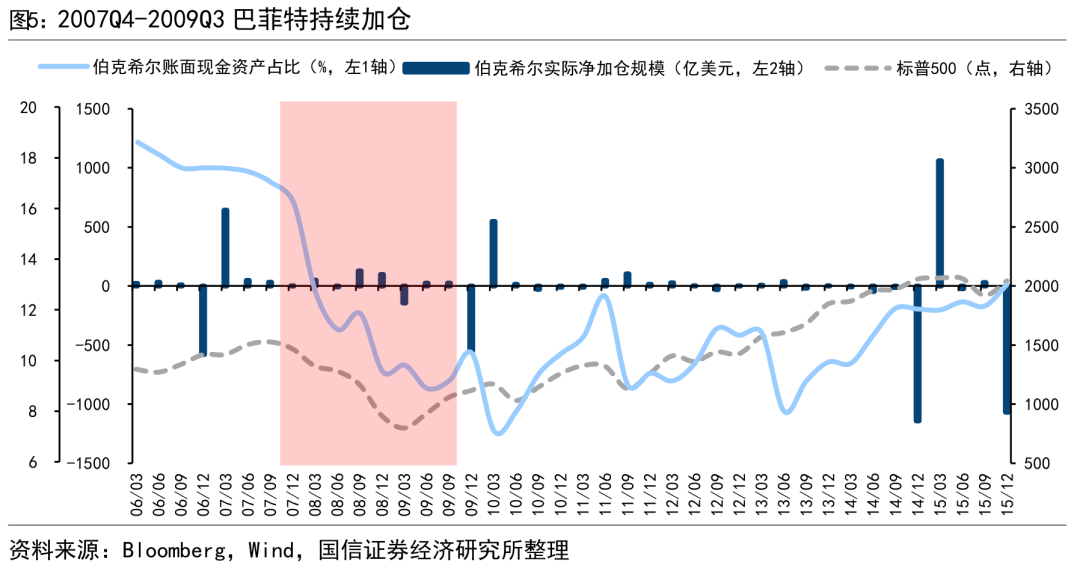
After the financial crisis broke out in 2008, Buffett increased his positions drastically. On the eve of the financial crisis, Buffett adopted a defensive strategy. At the end of June 2007, Berkshire's cash ratio on book reached 18%. Beginning in 07Q4, as the stock market continued to decline, Buffett continued to increase his positions. In particular, the 08Q3-Q4 market fell in a panic. Buffy increased his positions sharply. The cumulative actual increase of 22.5 billion US dollars over the two quarters, and Berkshire's cash ratio fell below 10% at the end of 2008. Since then, Berkshire has maintained a high stock position overall from 2009 to 2015, and the cash ratio remained in the 7%-12% range.
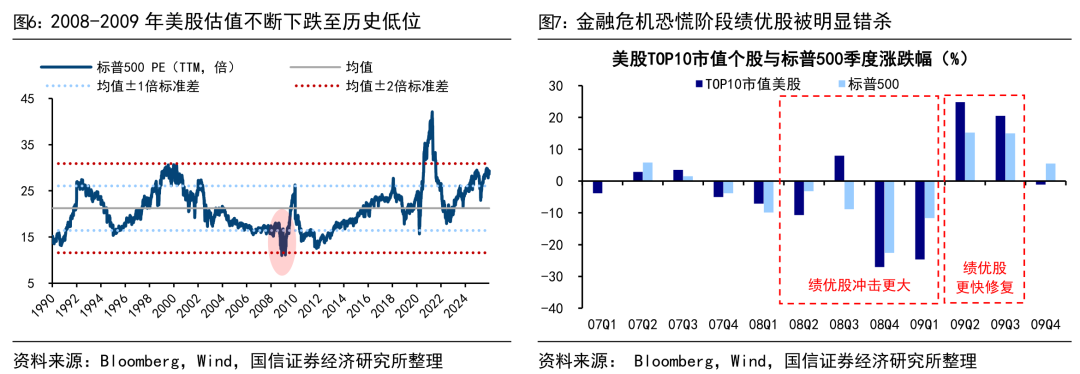
Looking in the rearview mirror: Buffett performed well by bucking the trend and buying high-quality companies when the market was panicking. After the US housing market peaked in 2006, the default rate rose, subprime mortgage products plummeted, and in 2007-2008, Bearsden Fund and Lehman Brothers exploded one after another, eventually triggering a global financial crisis. US stocks fell sharply in the second half of 2008. PE of the S&P 500 quickly fell from an 18-fold high to 10 times, once falling below the average of 2 times the standard deviation since 1990. Buffett bucked the trend and increased his positions when the market was fearful and declined, undermining high-quality assets such as Goldman Sachs, Swiss Re, General Electric, and BNSF Railways. These high-quality products fell even deeper during the crisis. Buffett was able to buy a “really good company” at a lower price, and shares rose even more after the crisis, as shown in Figure 7. This operation is a typical example of “I'm greedy when others are afraid”.
4. Depreciation of positions when systematically overestimated: 16Q2-17Q2
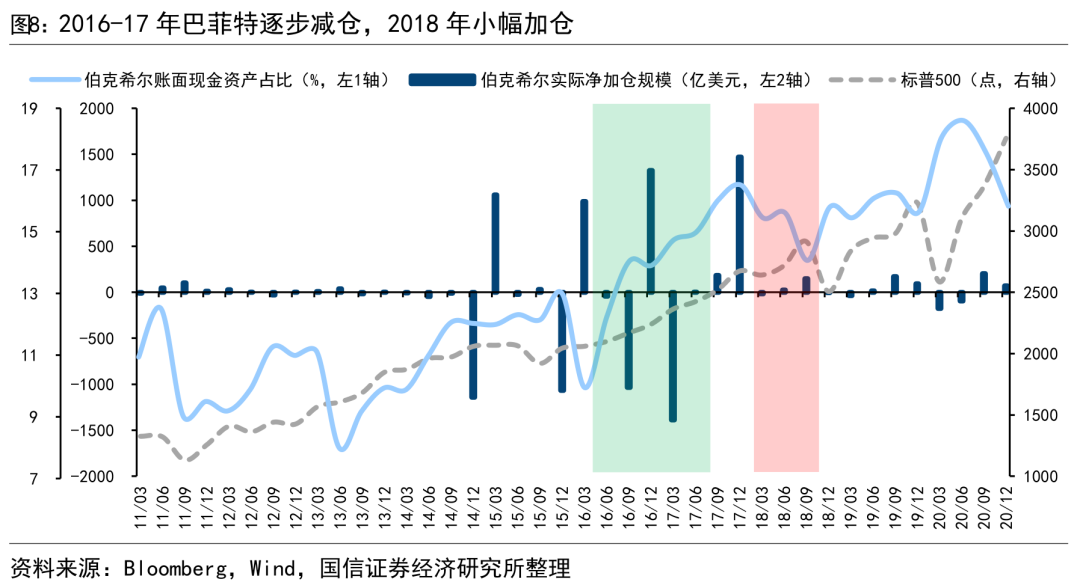
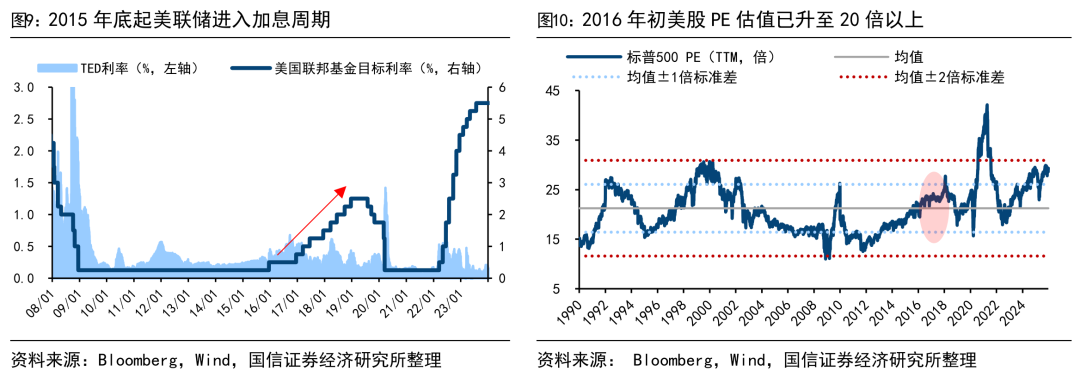
After several years of continuous growth in US stocks, Buffett cut positions in 2016-17. After the 2008 financial crisis, US stocks continued to rise for 7 years, spurred by quantitative easing and other measures. Buffett began to gradually reduce his stock holdings in 2016 Q2. 2016Q3 and 2017 Q1 drastically reduced his positions, both of which exceeded 100 billion US dollars in the quarter. Berkshire's cash ratio on book rose from 10% at the beginning of 2016 to around 16% at the end of 2017, and remained fluctuating around 15% until the end of 2023. During this period, when the market declined in 2018, Buffett slightly increased his position.
Looking in the rearview mirror: Buffett drastically reduced positions when the market was overvalued and moderately increased during market adjustments. After the 2008 financial crisis, the Federal Reserve began an era of zero interest rates. Under a relaxed environment, US stocks began booming in March 2009. However, under the sign of prosperity, undercurrents surged. At the end of 2015, the Federal Reserve began a cycle of interest rate hikes, global economic growth slowed, and geopolitical risks abounded. Meanwhile, US stock valuations climbed to historic highs. By the end of 2016 Q1, the S&P 500 PE (TTM) had risen 22.4 times, close to the average +1 times standard deviation since 1990. Buffett continued to reduce its positions from 16Q2-17Q2, and the cash ratio rose to 16%. In 2018, US stocks fell slightly by 6%, and fluctuated sharply during the year. During this period, Buffett lowered his chips and increased his positions slightly, and the cash ratio fell slightly to 14%. Beginning in 2019, US stocks continued to rise sharply.
5. Increase positions when extreme events plummet: 11Q3, 22Q1-2
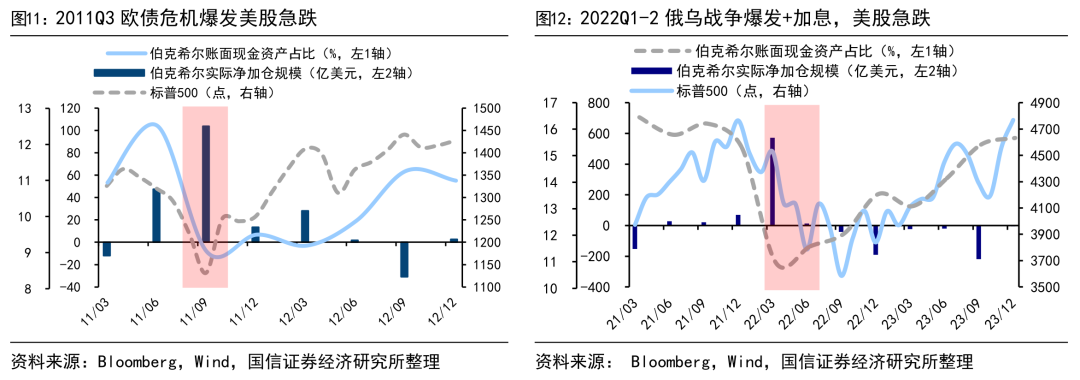
Looking back at historical data, it can be seen that when the stock market fell rapidly after extreme events occurred, Buffett resolutely increased his positions, such as the 2011 European debt crisis and the 2022 Russian-Ukrainian war.
The 2011Q3 European debt crisis caused the stock market to plummet. Buffett increased his positions sharply, and after the crisis, his positions returned to before the crisis. After Greece's new bailout plan was announced in July 2011, concerns about the European debt crisis grew, global stock markets fell, and the S&P 500 plummeted by more than 15% within two months. In 2011Q3, Berkshire bucked the trend and sharply increased its position by 10.4 billion US dollars, and the cash ratio fell from 13% in 2011Q2 to 9% in 2011Q3. Subsequently, with the help of the Federal Reserve's reversal of operations in September and the ECB's LTRO in October, the S&P 500 began to recover from its October low. By mid-2012, the cumulative increase reached 29%. In Q3 of 2012, Buffett began reducing his crisis position, and his cash position returned to 11%.
At the beginning of 2022, the Russian-Ukrainian conflict broke out and the stock market plummeted. Buffett increased his position sharply, and after the stock market stabilized, his position returned to where it had plummeted. The Russian-Ukrainian conflict officially broke out on February 24, 2022, and market panic spread. Combined with the impact of the Federal Reserve starting the interest rate hike cycle in March, the S&P 500 index fell by more than 20% in half a year. Berkshire continued to increase its stock holdings during this period, increasing its actual holdings by a cumulative total of US$58.5 billion in the first half of 2022. The cash ratio fell from 15% in Q4 2021 to 11% in Q2 2022. The market gradually picked up in the fourth quarter of 2022. At 22Q4, the S&P 500 had a maximum increase of 18%. Berkshire began to gradually reduce its positions until the end of 2023, and the cash ratio returned close to 15% of the level at the end of 2021.
It can be seen from this that Buffett seizes the opportunity of each sharp drop to increase his position, and then lowers his position after market panic has subsided and the rise has resumed, which is equivalent to carrying out a “wave operation” without wasting any crisis.
6. Notable: Reduced positions from 24Q1-25Q3
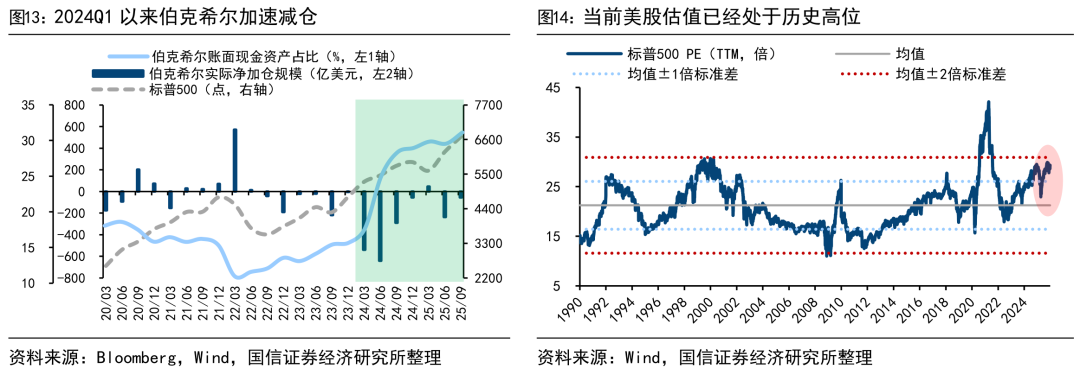
Positions have continued to be reduced since '24, and the current cash ratio has risen to a record high of 31%. Since 2022, Berkshire's holdings have changed markedly: cash positions have continued to rise and stock positions have declined at the same time. As mentioned earlier, in 2022/Q1, the market fell rapidly due to the Russian-Ukrainian conflict. Buffett bucked the trend and opened a sharp position, and the cash ratio on book fell to a low of about 11%. Since then, starting in 2022Q2, the cash ratio has gradually rebounded. At the beginning, it was more like a normal recovery after a low level. The cash ratio on the books rose from 11% to the normal level of 16% in 2022Q2-2023Q4. After entering 2024, the pace of increase in the cash ratio accelerated markedly, rapidly rising from 16% to 31% in 2025Q3, and accompanied by more vigorous stock reduction. The cumulative reduction scale in the last 7 quarters reached 177.4 billion US dollars, showing a more clear defensive operation.
The reduction in positions reflects Buffett's concerns about overvaluing US stocks. As can be seen from the previous analysis, Buffett showed outstanding timing effects in the past bullbear cycle, which was actually the result of implementing “I am greedy when others are afraid, and I am afraid when others are greedy.” The continued rise in Berkshire's cash position in this round is more like forward-looking risk management based on historical experience.
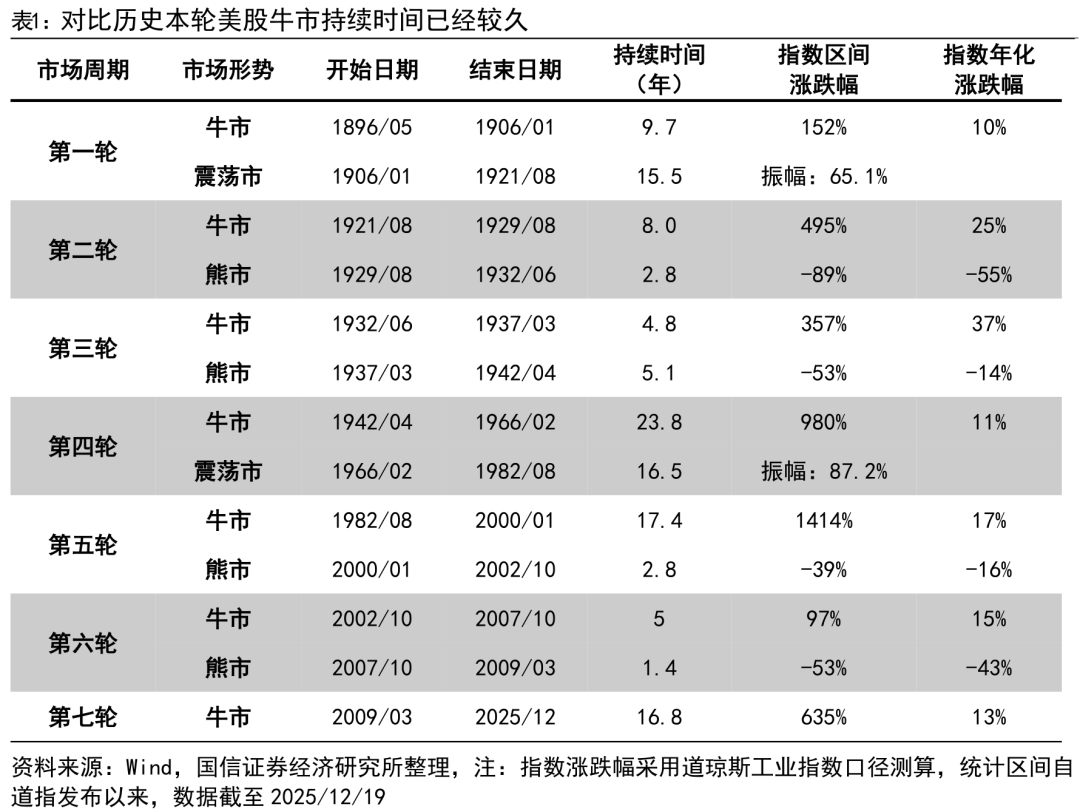
Behind this, there may be an implied cautious attitude about the current high overall valuation of US stocks. Since 2023, most of the increase in US stocks has been contributed by the top 7 technology companies, driving the continuous rise in US stock valuations, especially in the technology sector. As of 2025/12/19, S&P 500 PE (TTM, same below) was 29.1 times, at 94% since 1990, which is close to the level of the 2000 Tech Net bubble period; Nasdaq PE is 41.4 times, at 81% since 2003. Although it has not reached its peak in 2000, it is also in the middle to high range in history.
In addition to valuations, looking at comparative history, this round of the US stock bull market has been going on for a long time. Since the establishment of the Dow in 1896, US stocks have gone through a total of 6 full bull and bear cycles. The duration of a single round of bull market ranges from 5 to 24 years, with an average value of about 12 years. However, since this round of the bull market began in March 2009, it has been close to 17 years. The duration is not only higher than the historical average, but also close to the duration of the 1982-2000 bull market.