
- LIVE QUOTES
- LEARN
- HELP
 Nasdaq
 Wall Street Journal
EN
VeriSign (VRSN) Valuation After Berkshire Hathaway Trims Stake to Stay Below 10% Ownership Threshold
Berkshire Hathaway trimming its VeriSign (VRSN) stake by about 1.2 billion dollars to stay under the 10% ownership threshold has quickly refocused investor attention on the domain registry leader and its long term return profile.
See our latest analysis for VeriSign.
While Berkshire’s trim grabbed headlines, the bigger story is that VeriSign’s share price has climbed to about $245.75 with a solid year to date share price return of 19.82%, and its 1 year total shareholder return of 21.55% suggests steady, if not explosive, momentum rather than a sharp re rating.
If this kind of steady compounder appeals to you, it is also worth scanning other infrastructure-like opportunities by exploring high growth tech and AI stocks.
With shares now trading near 20% below the average analyst target but only a modest intrinsic discount implied by cash flow models, investors face a key question: Is VeriSign still mispriced, or is future growth already fully reflected?
Most Popular Narrative Narrative: 16.8% Undervalued
With VeriSign last closing at $245.75 versus a narrative fair value of $295.50, the gap suggests investors may be underestimating its staying power.
Analysts are assuming VeriSign's revenue will grow by 6.4% annually over the next 3 years. Analysts assume that profit margins will increase from 50.0% today to 53.0% in 3 years time.
Curious how modest growth and expanding margins can still justify a punchy future earnings multiple, even above the broader tech benchmark? Unpack the full playbook behind this valuation.
Result: Fair Value of $295.50 (UNDERVALUED)
Have a read of the narrative in full and understand what's behind the forecasts.
However, a deeper shift in parked domain advertising economics or weaker renewal quality could quickly undermine the current margin and earnings trajectory.
Find out about the key risks to this VeriSign narrative.
Another Angle on Value
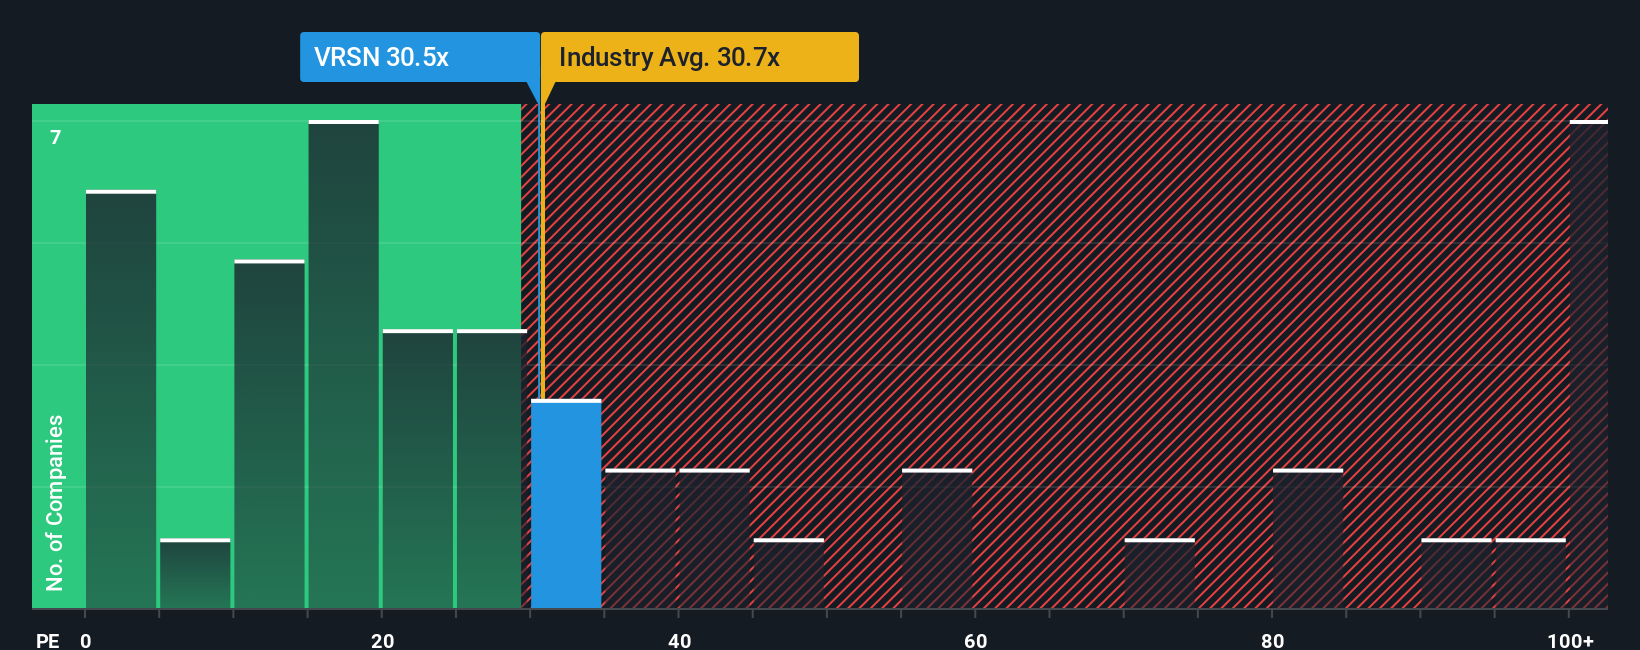
On earnings, VeriSign looks modestly cheap rather than clearly mispriced. Its P E of 28.1x sits below both the US IT industry at 29.6x and peers at 42.1x, and close to a 29x fair ratio, which hints at limited margin of safety if sentiment turns.
See what the numbers say about this price — find out in our valuation breakdown.
Simply Wall St performs a discounted cash flow (DCF) on every stock in the world every day (check out VeriSign for example). We show the entire calculation in full. You can track the result in your watchlist or portfolio and be alerted when this changes, or use our stock screener to discover 901 undervalued stocks based on their cash flows. If you save a screener we even alert you when new companies match - so you never miss a potential opportunity.
Build Your Own VeriSign Narrative
If you would rather dive into the numbers yourself and challenge these assumptions, you can build a personalized view in just a few minutes: Do it your way.
A great starting point for your VeriSign research is our analysis highlighting 4 key rewards and 3 important warning signs that could impact your investment decision.
Looking for more investment ideas?
Before you move on, lock in an edge by scanning fresh opportunities across themes and sectors, so you are not relying on just one great story.
- Tap into potential income and stability by reviewing these 10 dividend stocks with yields > 3% that could complement a growth focused portfolio.
- Capture structural tailwinds in automation and data by assessing these 24 AI penny stocks positioned at the forefront of intelligent software and infrastructure.
- Hunt for quality at a reasonable price with these 901 undervalued stocks based on cash flows, and reduce the risk of missing today’s discounted leaders.
This article by Simply Wall St is general in nature. We provide commentary based on historical data and analyst forecasts only using an unbiased methodology and our articles are not intended to be financial advice. It does not constitute a recommendation to buy or sell any stock, and does not take account of your objectives, or your financial situation. We aim to bring you long-term focused analysis driven by fundamental data. Note that our analysis may not factor in the latest price-sensitive company announcements or qualitative material. Simply Wall St has no position in any stocks mentioned.
Have feedback on this article? Concerned about the content? Get in touch with us directly. Alternatively, email editorial-team@simplywallst.com