
- LIVE QUOTES
- LEARN
- HELP
 Nasdaq
 Wall Street Journal
EN
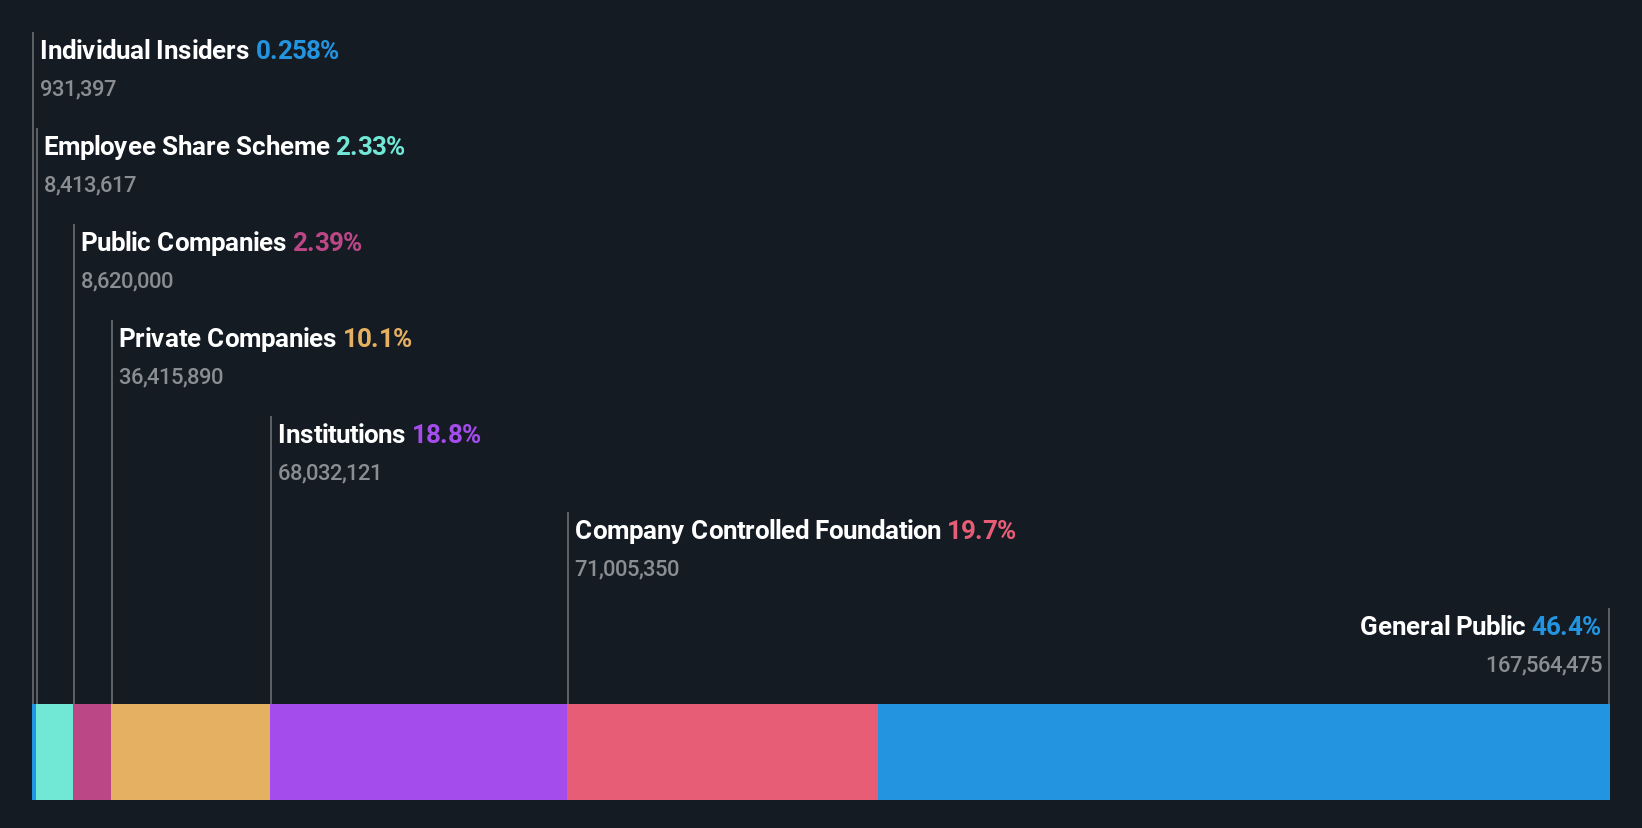
Hakuhodo DY Holdings Inc (TSE:2433) stock most popular amongst retail investors who own 46%, while company controlled foundation hold 20%
Key Insights
- Significant control over Hakuhodo DY Holdings by retail investors implies that the general public has more power to influence management and governance-related decisions
- A total of 16 investors have a majority stake in the company with 50% ownership
- Institutions own 19% of Hakuhodo DY Holdings
If you want to know who really controls Hakuhodo DY Holdings Inc (TSE:2433), then you'll have to look at the makeup of its share registry. The group holding the most number of shares in the company, around 46% to be precise, is retail investors. That is, the group stands to benefit the most if the stock rises (or lose the most if there is a downturn).
Meanwhile, company controlled foundation make up 20% of the company’s shareholders.
In the chart below, we zoom in on the different ownership groups of Hakuhodo DY Holdings.
View our latest analysis for Hakuhodo DY Holdings
What Does The Institutional Ownership Tell Us About Hakuhodo DY Holdings?
Institutional investors commonly compare their own returns to the returns of a commonly followed index. So they generally do consider buying larger companies that are included in the relevant benchmark index.
We can see that Hakuhodo DY Holdings does have institutional investors; and they hold a good portion of the company's stock. This implies the analysts working for those institutions have looked at the stock and they like it. But just like anyone else, they could be wrong. When multiple institutions own a stock, there's always a risk that they are in a 'crowded trade'. When such a trade goes wrong, multiple parties may compete to sell stock fast. This risk is higher in a company without a history of growth. You can see Hakuhodo DY Holdings' historic earnings and revenue below, but keep in mind there's always more to the story.

Hedge funds don't have many shares in Hakuhodo DY Holdings. Our data shows that Hakuhodo Foundation is the largest shareholder with 20% of shares outstanding. Hakuseikai Limited Association is the second largest shareholder owning 5.1% of common stock, and The Asahi Shimbun Company holds about 3.1% of the company stock.
Looking at the shareholder registry, we can see that 50% of the ownership is controlled by the top 16 shareholders, meaning that no single shareholder has a majority interest in the ownership.
While it makes sense to study institutional ownership data for a company, it also makes sense to study analyst sentiments to know which way the wind is blowing. There are plenty of analysts covering the stock, so it might be worth seeing what they are forecasting, too.
Insider Ownership Of Hakuhodo DY Holdings
The definition of company insiders can be subjective and does vary between jurisdictions. Our data reflects individual insiders, capturing board members at the very least. Management ultimately answers to the board. However, it is not uncommon for managers to be executive board members, especially if they are a founder or the CEO.
I generally consider insider ownership to be a good thing. However, on some occasions it makes it more difficult for other shareholders to hold the board accountable for decisions.
Our most recent data indicates that insiders own less than 1% of Hakuhodo DY Holdings Inc. However, it's possible that insiders might have an indirect interest through a more complex structure. Keep in mind that it's a big company, and the insiders own JP¥1.1b worth of shares. The absolute value might be more important than the proportional share. It is always good to see at least some insider ownership, but it might be worth checking if those insiders have been selling.
General Public Ownership
With a 46% ownership, the general public, mostly comprising of individual investors, have some degree of sway over Hakuhodo DY Holdings. This size of ownership, while considerable, may not be enough to change company policy if the decision is not in sync with other large shareholders.
Private Company Ownership
We can see that Private Companies own 10%, of the shares on issue. It's hard to draw any conclusions from this fact alone, so its worth looking into who owns those private companies. Sometimes insiders or other related parties have an interest in shares in a public company through a separate private company.
Next Steps:
While it is well worth considering the different groups that own a company, there are other factors that are even more important. For instance, we've identified 3 warning signs for Hakuhodo DY Holdings that you should be aware of.
But ultimately it is the future, not the past, that will determine how well the owners of this business will do. Therefore we think it advisable to take a look at this free report showing whether analysts are predicting a brighter future.
NB: Figures in this article are calculated using data from the last twelve months, which refer to the 12-month period ending on the last date of the month the financial statement is dated. This may not be consistent with full year annual report figures.
Have feedback on this article? Concerned about the content? Get in touch with us directly. Alternatively, email editorial-team (at) simplywallst.com.
This article by Simply Wall St is general in nature. We provide commentary based on historical data and analyst forecasts only using an unbiased methodology and our articles are not intended to be financial advice. It does not constitute a recommendation to buy or sell any stock, and does not take account of your objectives, or your financial situation. We aim to bring you long-term focused analysis driven by fundamental data. Note that our analysis may not factor in the latest price-sensitive company announcements or qualitative material. Simply Wall St has no position in any stocks mentioned.