
- LIVE QUOTES
- LEARN
- HELP
 Nasdaq
 Wall Street Journal
EN
Is It Too Late To Consider Rocket Lab After Its 209% 2025 Rally?
- If you are wondering whether Rocket Lab is still a smart consideration after its massive run, or if you are arriving just as the story is getting overheated, this breakdown will help you separate hype from genuine value.
- The stock has moved sharply higher recently, up around 43% over the last week, 81.8% over the last month and an eye catching 209.2% year to date. Those moves naturally raise questions about both potential upside and downside from here.
- Behind these moves, investors have been reacting to a steady drumbeat of positive developments, from contract wins with government and commercial customers to progress on the Neutron launch vehicle, which could shift Rocket Lab into a much larger addressable market. At the same time, the broader enthusiasm for space and defense related names has added fuel, as the market reprices companies tied to launch services and satellite infrastructure.
- Yet despite all that excitement, Rocket Lab currently scores just 0 out of 6 on our valuation checks. This suggests the market might already be baking in a lot of good news. Next, we will walk through the standard valuation approaches and then finish with a more holistic way to think about what this business could really be worth over time.
Rocket Lab scores just 0/6 on our valuation checks. See what other red flags we found in the full valuation breakdown.
Approach 1: Rocket Lab Discounted Cash Flow (DCF) Analysis
A Discounted Cash Flow model estimates what a business is worth by projecting its future cash flows and then discounting those projections back to today, using a required rate of return. For Rocket Lab, the model uses a 2 Stage Free Cash Flow to Equity approach, starting from last twelve months free cash flow of roughly -$220.3 Million and moving toward positive territory as the business scales.
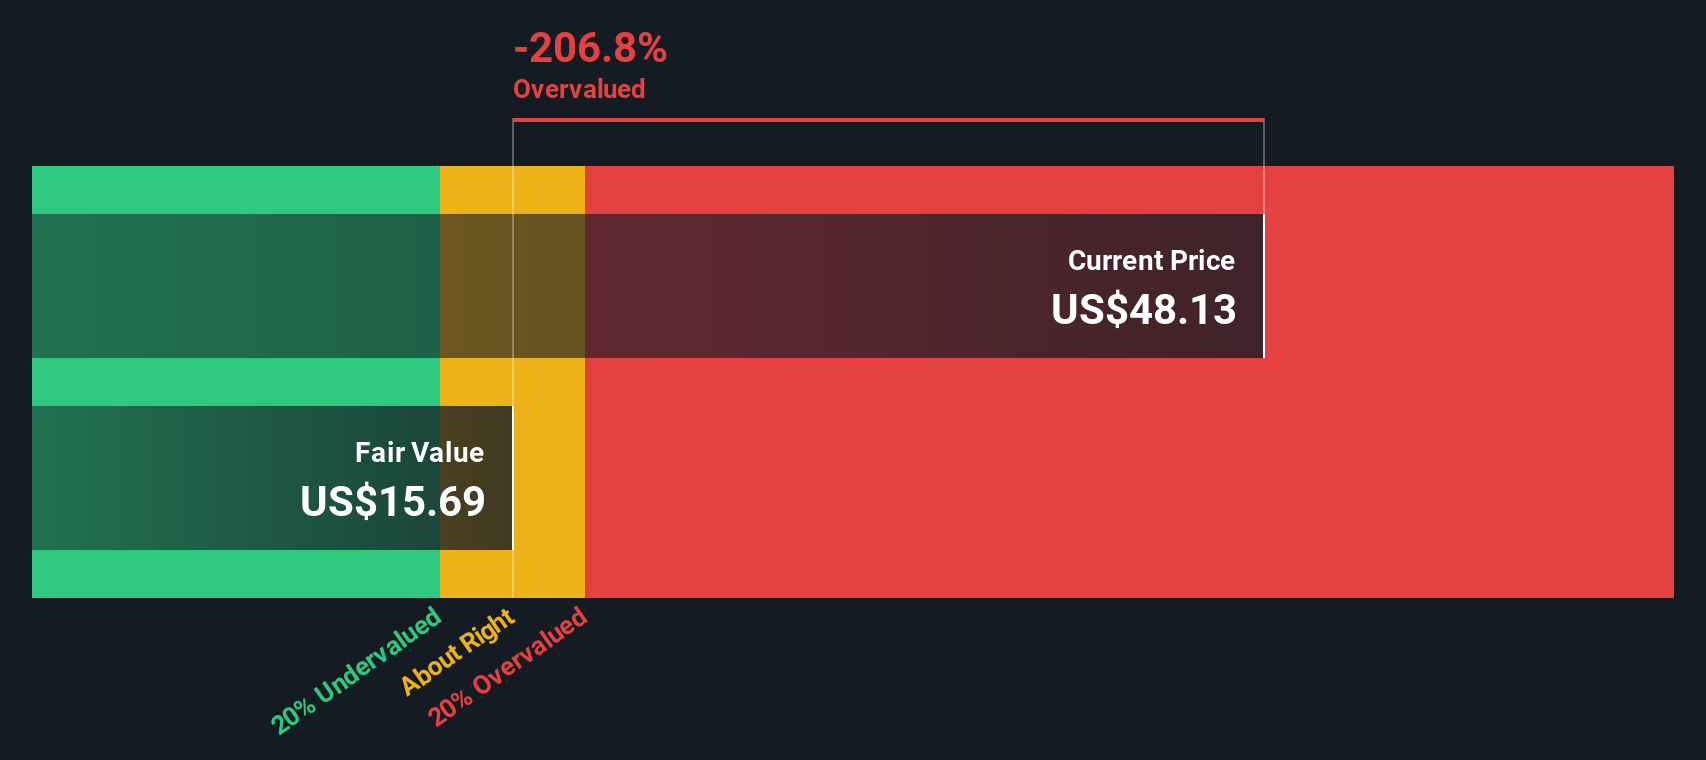
Analyst forecasts and extrapolations by Simply Wall St see free cash flow improving to about $612 Million by 2029 and rising further to roughly $1.34 Billion by 2035, all in $. These projected cash flows are discounted back to arrive at an estimated intrinsic value of about $37.26 per share. Compared with the current share price, this implies the stock is roughly 107.1% overvalued, suggesting the market is already pricing in very optimistic execution on growth and profitability.
Result: OVERVALUED
Our Discounted Cash Flow (DCF) analysis suggests Rocket Lab may be overvalued by 107.1%. Discover 901 undervalued stocks or create your own screener to find better value opportunities.
Approach 2: Rocket Lab Price vs Book
For established and profitable companies, price to book is a useful cross check because it compares what investors are paying in the market with the net assets backing the business. In general, faster growth, higher returns on capital and lower risk justify a higher normal price to book multiple, while slower growth or higher uncertainty should pull that multiple down.
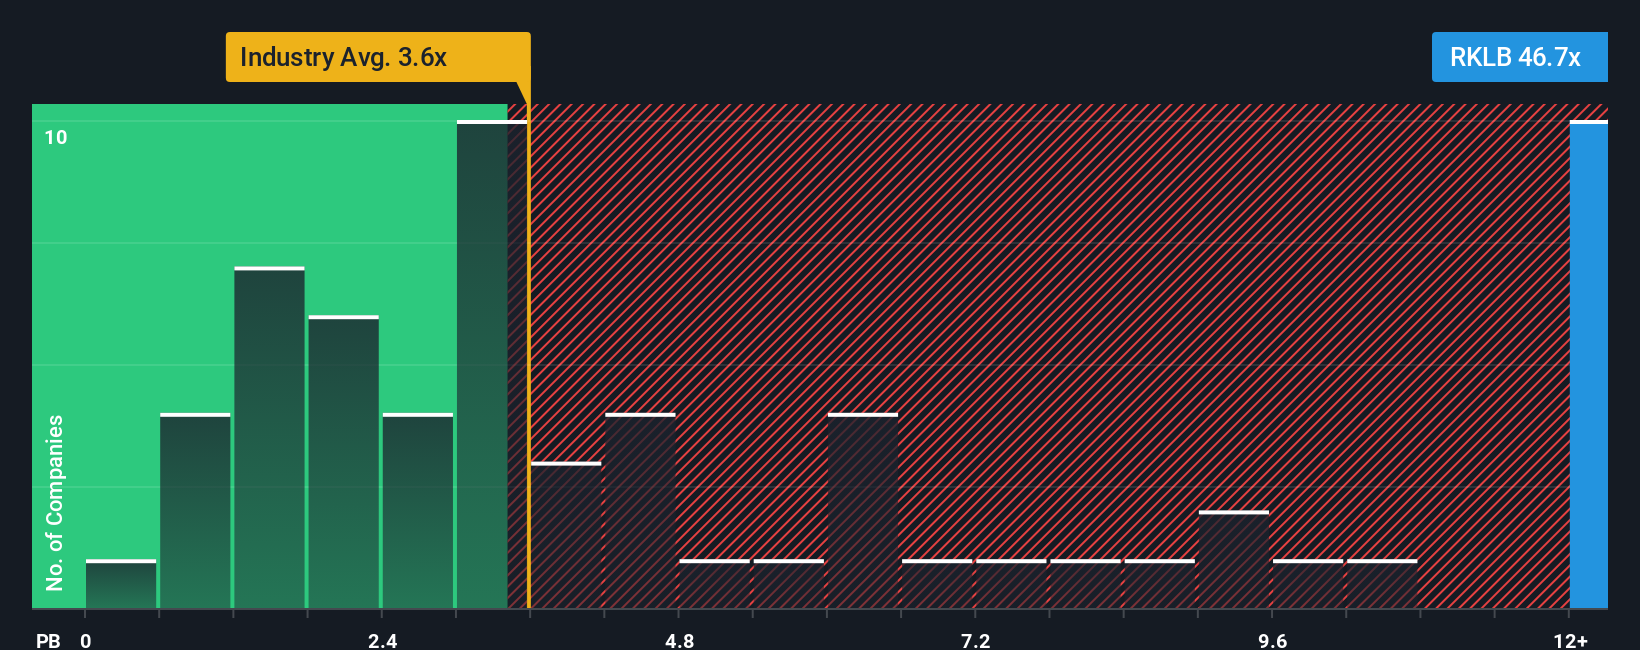
Rocket Lab currently trades at about 32.18x its book value, which is far richer than the Aerospace and Defense industry average of roughly 3.81x and also well above the peer group average of around 9.40x. Simply Wall St also calculates a Fair Ratio, a proprietary estimate of what price to book investors should reasonably pay given the company’s growth outlook, profitability profile, risk factors, industry and market cap. This tends to be more informative than a simple comparison with peers or the sector, because it adjusts for company specific strengths and weaknesses rather than assuming all firms deserve the same multiple.
On this basis, Rocket Lab screens as trading materially above its Fair Ratio, which points to a stretched valuation on the preferred multiple.
Result: OVERVALUED
PB ratios tell one story, but what if the real opportunity lies elsewhere? Discover 1459 companies where insiders are betting big on explosive growth.
Upgrade Your Decision Making: Choose your Rocket Lab Narrative
Earlier we mentioned that there is an even better way to understand valuation, so let's introduce you to Narratives, a simple tool on Simply Wall St's Community page. It lets you write the story behind your numbers by linking your view of a company to specific forecasts for revenue, earnings, margins and, ultimately, a fair value estimate. You can then compare that estimate directly with today’s share price to decide when to buy or sell. The tool automatically updates as new news or earnings arrive so your view stays current. This is why some Rocket Lab investors might build a very bullish Narrative that assumes the space backbone expands quickly, Neutron ramps smoothly and justifies a fair value near $98 per share. More cautious investors might input slower growth, lower margins and higher risk to arrive at a fair value closer to $20 to $25. Both perspectives can coexist transparently, fully quantified and easy to track over time.
For Rocket Lab however we will make it really easy for you with previews of two leading Rocket Lab Narratives:
Fair value estimate: $97.83 per share
Implied discount vs last close: approximately 21.1% undervalued
Assumed revenue growth: 55%
- Views Rocket Lab as a vertically integrated backbone provider across launch and space systems, targeting around 5% of the ~$800 billion space backbone economy by 2035.
- Assumes Neutron achieves competitive low cost, high cadence launches, enabling revenue to scale to about $44 billion with 20% net margins and positioning Rocket Lab as a strong number two behind SpaceX.
- Sees current valuation dips as buying opportunities in a long runway story, with execution, capital discipline and Neutron success as the main swing factors.
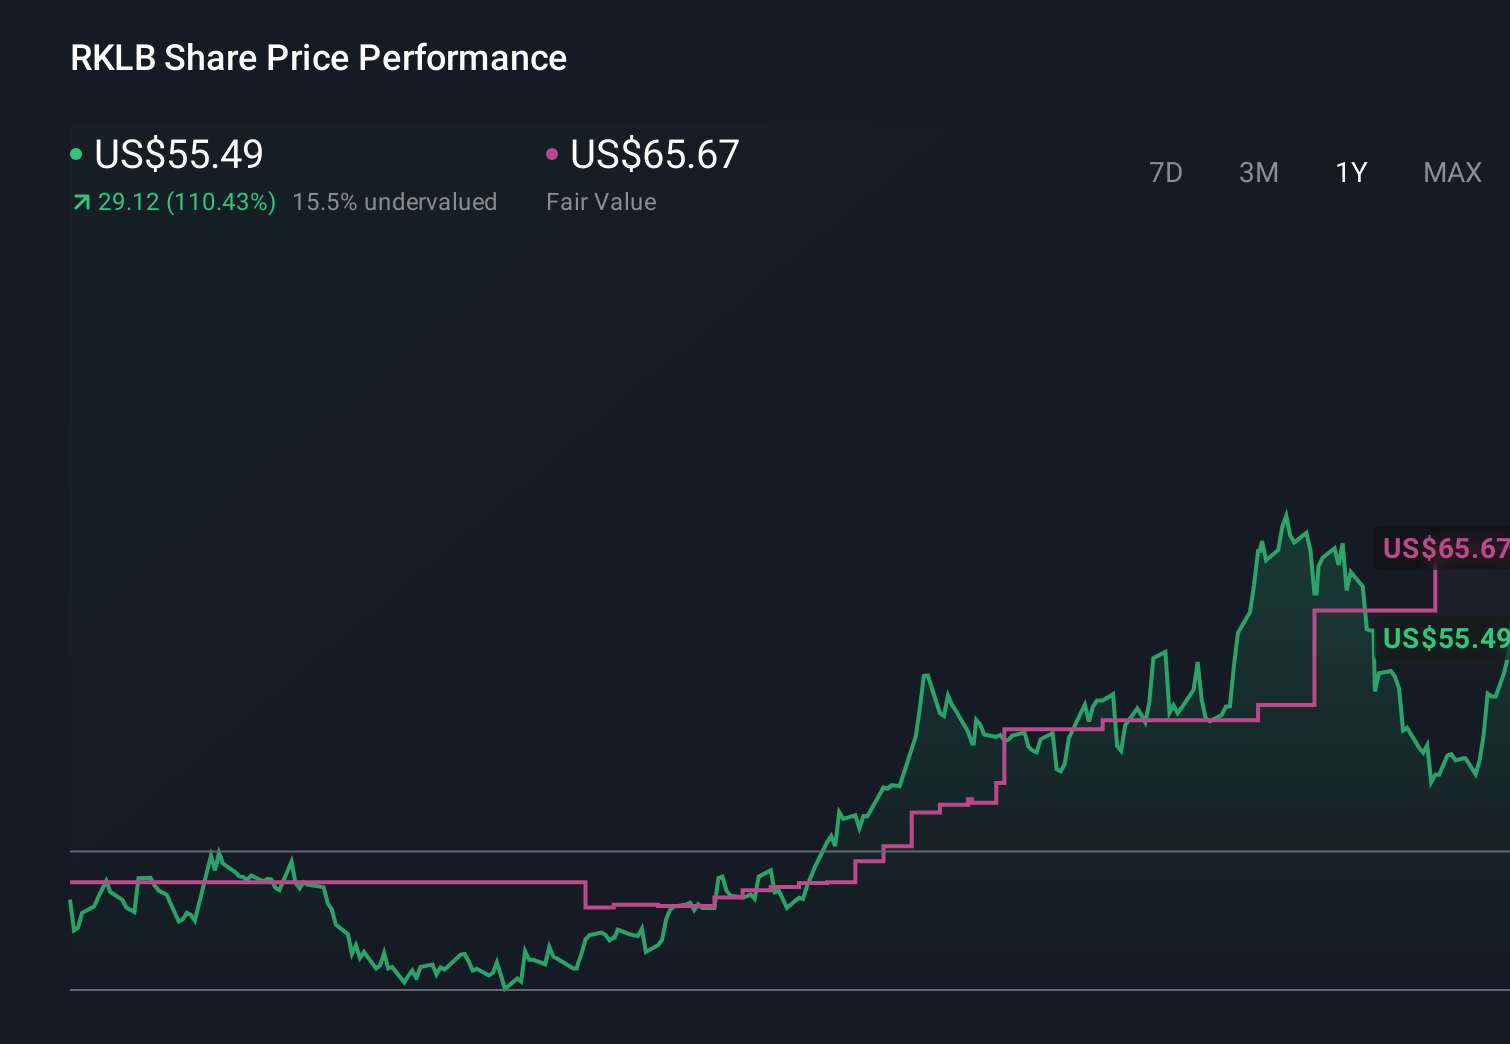
Fair value estimate: $65.67 per share
Implied premium vs last close: approximately 17.4% overvalued
Assumed revenue growth: 36.36%
- Accepts strong structural tailwinds from launch demand, defense contracts and space systems growth, but expects these to be largely reflected in the current share price.
- Models revenue reaching about $1.3 billion and earnings of $113.4 million by 2028, but highlights that this requires a very rich 216.7x PE multiple and continued access to capital during a cash intensive Neutron build out.
- Flags risks around Neutron timing, contract lumpiness, integration of acquisitions and regulatory or budget headwinds, concluding that the stock already prices in much of the upside and offers limited margin of safety at current levels.
Do you think there's more to the story for Rocket Lab? Head over to our Community to see what others are saying!
This article by Simply Wall St is general in nature. We provide commentary based on historical data and analyst forecasts only using an unbiased methodology and our articles are not intended to be financial advice. It does not constitute a recommendation to buy or sell any stock, and does not take account of your objectives, or your financial situation. We aim to bring you long-term focused analysis driven by fundamental data. Note that our analysis may not factor in the latest price-sensitive company announcements or qualitative material. Simply Wall St has no position in any stocks mentioned.
Have feedback on this article? Concerned about the content? Get in touch with us directly. Alternatively, email editorial-team@simplywallst.com