
- LIVE QUOTES
- LEARN
- HELP
 Nasdaq
 Wall Street Journal
EN
Is Darden Restaurants Still a Tasty Opportunity After Its Five Year 89.2% Share Price Climb?
- Wondering if Darden Restaurants at around $189.91 is still a tasty opportunity or if most of the value is already baked in? This article will help you decide.
- The stock has climbed 9.6% over the last month and 89.2% over five years, with a steadier 4.8% gain over the past year that suggests expectations are adjusting rather than surging.
- Recent attention on consumer spending resilience and dining trends has kept Darden in the spotlight, as investors weigh how much pricing power and traffic growth are already in the share price. At the same time, ongoing discussion about shifts in discretionary spending has made restaurant names like Darden a gauge for how confident the market is about the broader economy.
- On our valuation checks, Darden scores a 4/6 valuation score, implying it looks undervalued on several fronts, but not across the board. Next, we will unpack what that means by walking through different valuation approaches, before closing with a more practical way to make sense of Darden's value.
Find out why Darden Restaurants's 4.8% return over the last year is lagging behind its peers.
Approach 1: Darden Restaurants Discounted Cash Flow (DCF) Analysis
A Discounted Cash Flow model estimates what a business is worth by projecting its future cash flows and then discounting them back to today, using a required return to reflect risk and the time value of money.
For Darden Restaurants, the latest twelve month Free Cash Flow is about $988.6 Million. Analysts and extrapolated estimates used in this 2 Stage Free Cash Flow to Equity model see FCF rising steadily, with projections reaching roughly $2.29 Billion by 2035 as growth moderates over time.
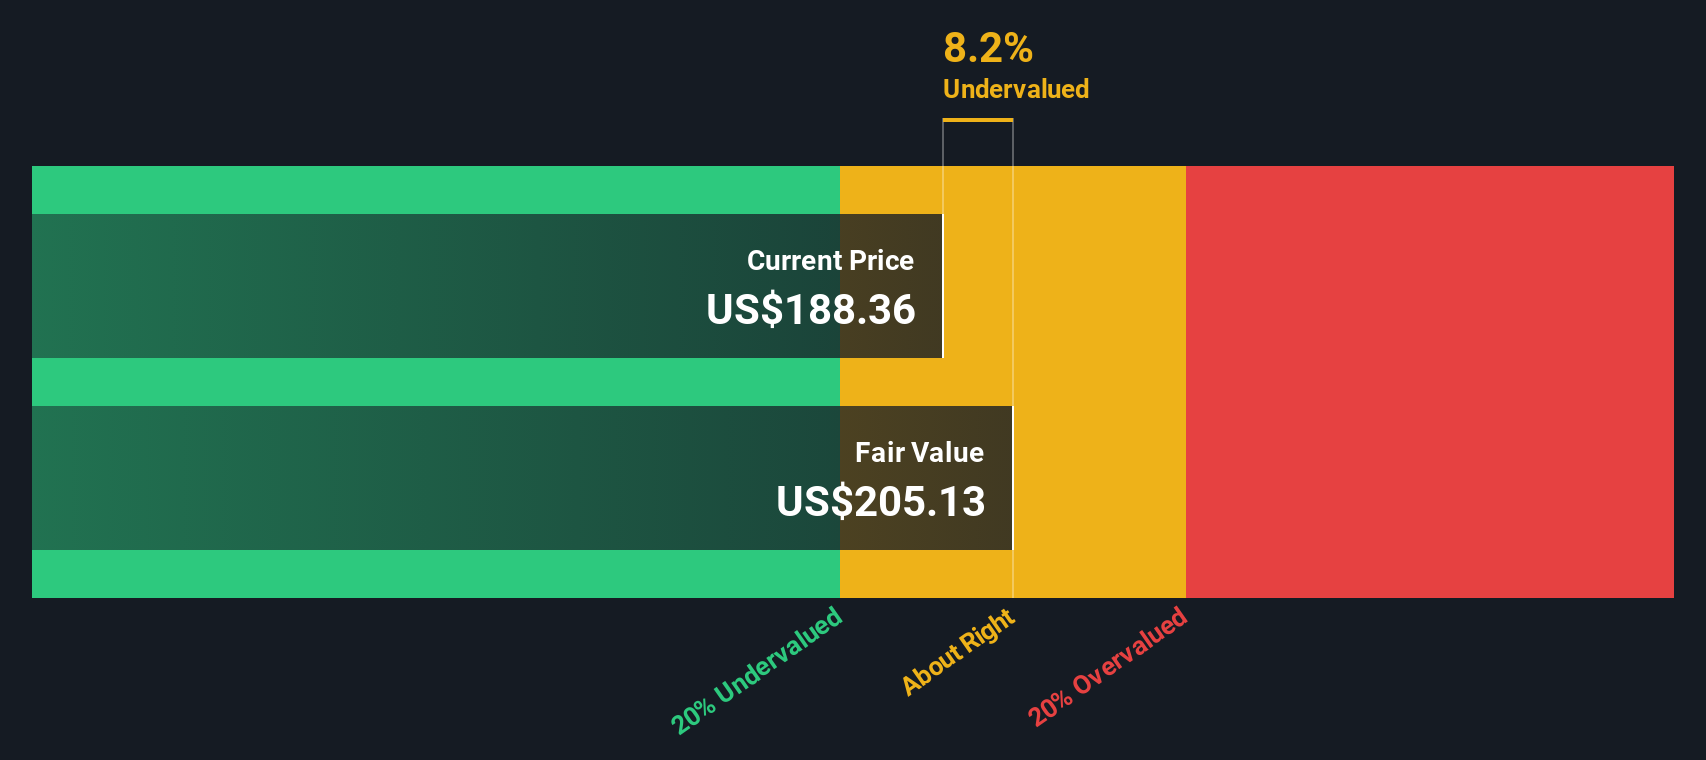
When all those future cash flows are discounted back to the present, the DCF model points to an intrinsic value of about $224.55 per share. Compared with the current share price around $189.91, this implies the stock is trading at roughly a 15.4% discount to its estimated fair value. This indicates potential upside if these assumptions hold.
Result: UNDERVALUED
Our Discounted Cash Flow (DCF) analysis suggests Darden Restaurants is undervalued by 15.4%. Track this in your watchlist or portfolio, or discover 901 more undervalued stocks based on cash flows.
Approach 2: Darden Restaurants Price vs Earnings
For profitable, established businesses like Darden Restaurants, the Price to Earnings ratio is a straightforward way to see how much investors are willing to pay for each dollar of current profits. In general, companies with faster, more reliable earnings growth and lower perceived risk tend to justify higher PE ratios, while slower growth or higher uncertainty usually means a lower, more conservative multiple is appropriate.
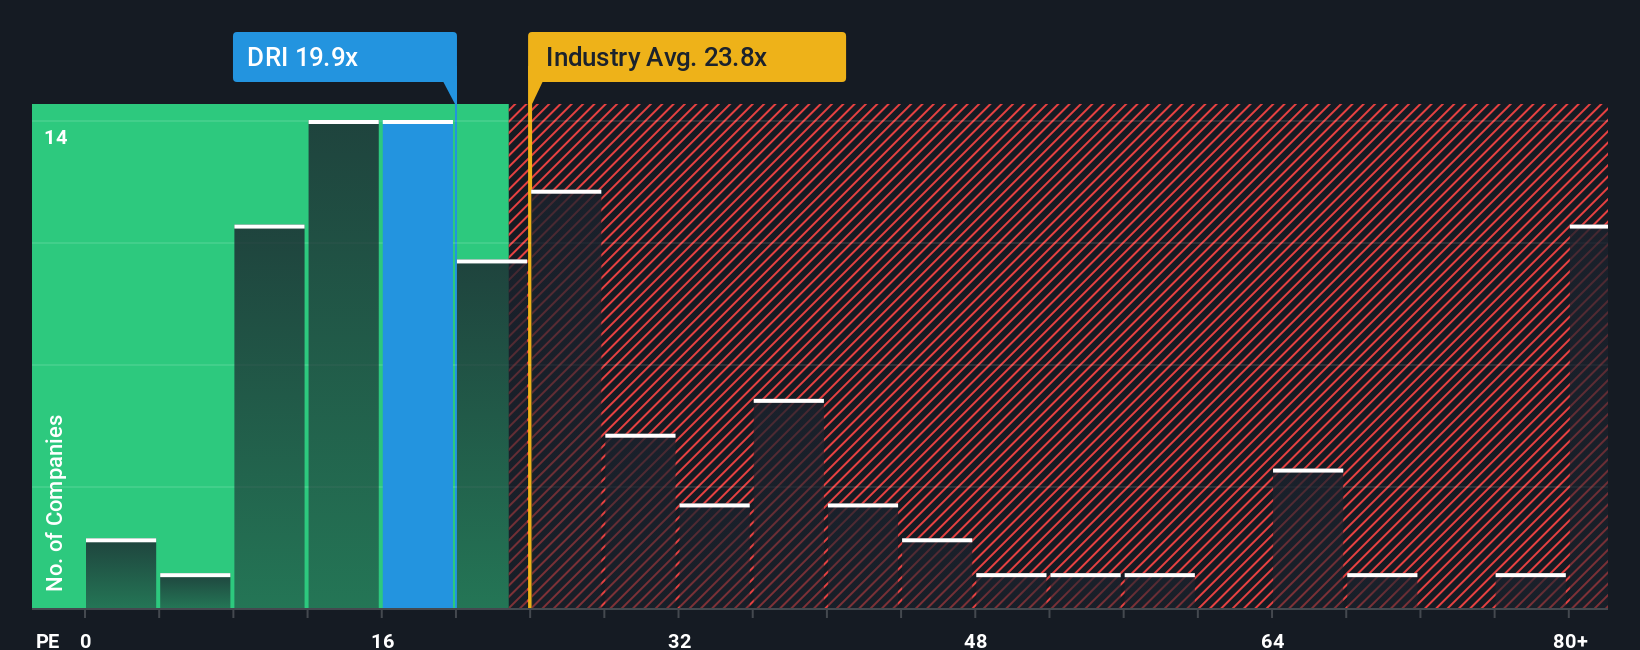
Darden currently trades around 19.67x earnings, which is below both the Hospitality industry average of about 21.87x and the broader peer group average of roughly 24.45x. On the surface, that discount suggests the market is pricing Darden a bit more cautiously than many of its restaurant and hospitality peers, despite its scale and established brands.
Simply Wall St’s Fair Ratio for Darden is 22.23x, a proprietary estimate of what a reasonable PE might be once you factor in the company’s earnings growth outlook, profitability, risk profile, industry, and market cap. That makes it more tailored than a simple comparison with industry or peer averages, which can be skewed by outliers. With the Fair Ratio above the current 19.67x, this framework points to Darden being modestly undervalued on an earnings multiple basis.
Result: UNDERVALUED
PE ratios tell one story, but what if the real opportunity lies elsewhere? Discover 1459 companies where insiders are betting big on explosive growth.
Upgrade Your Decision Making: Choose your Darden Restaurants Narrative
Earlier we mentioned that there is an even better way to understand valuation, so let us introduce Narratives, a simple way to connect your view of Darden Restaurants business to a set of numbers, by telling a story about its future revenue, earnings and margins that then flows through to a forecast and a Fair Value estimate you can compare against today’s share price.
On Simply Wall St’s Community page, millions of investors use Narratives as an accessible tool to frame questions like whether Olive Garden’s Uber Direct rollout and new smaller restaurant formats will keep driving mid single digit revenue growth and support a Fair Value closer to the most bullish view near $255, or whether risks around beef costs, softer guest counts and margin pressure justify a more cautious Fair Value nearer the bearish end around $157. Each Narrative updates automatically as news, earnings and guidance change so you can quickly see, in numbers, when your story still supports buying, holding or selling Darden based on the gap between its evolving Fair Value and live market price.
Do you think there's more to the story for Darden Restaurants? Head over to our Community to see what others are saying!

This article by Simply Wall St is general in nature. We provide commentary based on historical data and analyst forecasts only using an unbiased methodology and our articles are not intended to be financial advice. It does not constitute a recommendation to buy or sell any stock, and does not take account of your objectives, or your financial situation. We aim to bring you long-term focused analysis driven by fundamental data. Note that our analysis may not factor in the latest price-sensitive company announcements or qualitative material. Simply Wall St has no position in any stocks mentioned.
Have feedback on this article? Concerned about the content? Get in touch with us directly. Alternatively, email editorial-team@simplywallst.com